
Fig. 3.
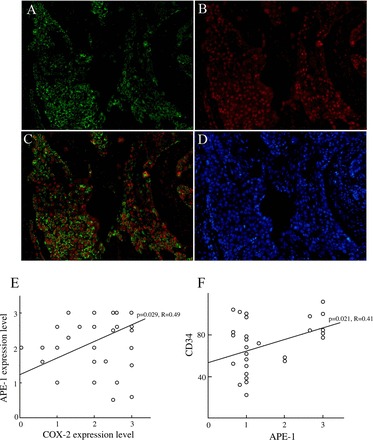
The relationship between APE-1 and COX-2 expression in esophageal cancer tissues. A: COX-2-positive cells (green cells) in the esophageal cancer tissues (original magnification, ×150). B: APE-1-positive cells (red cells) in the esophageal cancer tissues (original magnification, ×150). C: nuclear APE-1 and cytoplasmic COX-2 expressions were mainly coexpressed in the same section. Double-positive cells (yellow cells) reveal COX-2-and APE-1-positive cells in the same section (original magnification, ×150). D: 4′,6-diamidino-2-phenylindole staining (blue cells) (original magnification, ×150). E: there was a significant relationship (P = 0.029) between APE-1 and COX-2 expressions in the 65 patients with esophageal cancer. F: there was a significant relationship (P = 0.021, R = 0.41) between APE-1 and CD34-positive cells in the esophageal cancer tissues.