Fig. 2.
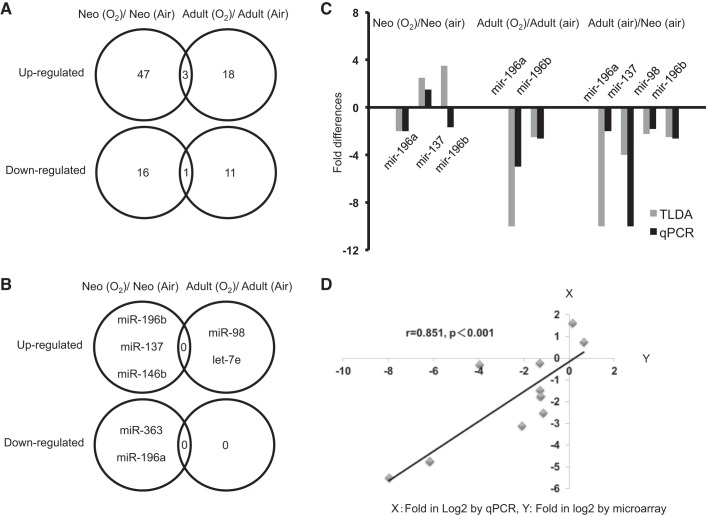
Altered miRNAs in neonatal vs. adult mouse lung. A: Venn diagram of altered miRNAs in neonatal vs. adult lungs. Fifty miRNAs increased more than twofold, and 17 miRNAs decreased by more than half in neonates exposed to hyperoxia. In adults exposed to hyperoxia, 21 miRNAs increased more than twofold, and 12 miRNAs decreased by more than half. B: this Venn diagram of miRNA related to Bach1 shows no altered miRNAs common to either neonatal or adult lungs exposed to hyperoxia on the basis of array data. C: selected miRNAs from the miRNA expression profile were validated by RT-quantitative PCR (qPCR). D: correlation between data from microarray and RT-PCR for selected miRNAs was performed using lineal regression. The x-axis represents fold in log2 by qPCR; the y-axis represents fold in log2 by TaqMan low-density array data.

