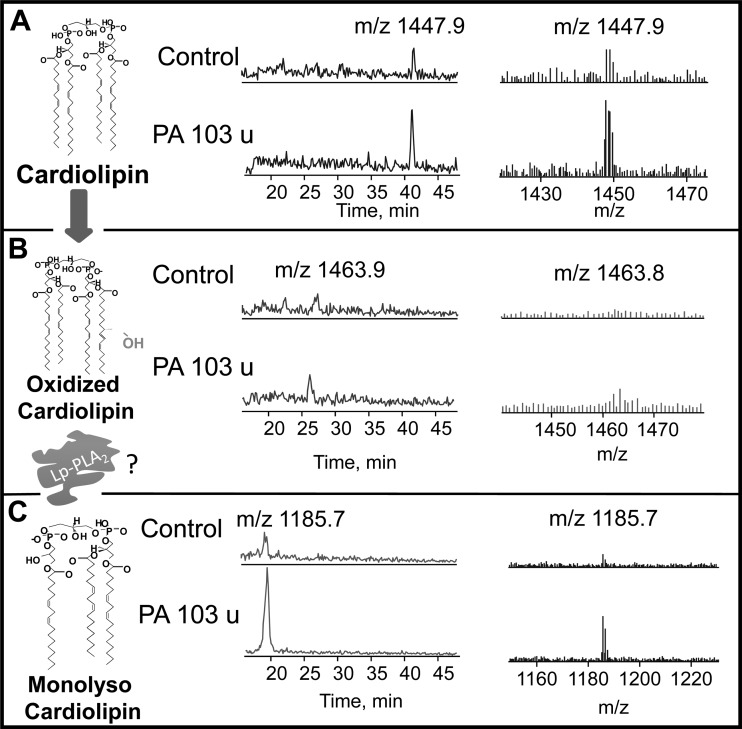
Fig. 12.
CLox and monolysoCL are present in Pseudomonas aeruginosa infection. LC-MS profiles of plasma from control and mice 4 h after Pseudomonas aeruginosa infection are shown for CL (A), CLox (B), and monolysoCL (C) with chemical structures of the hypothesized Lp-PLA2 hydrolysis pathway on the left.

