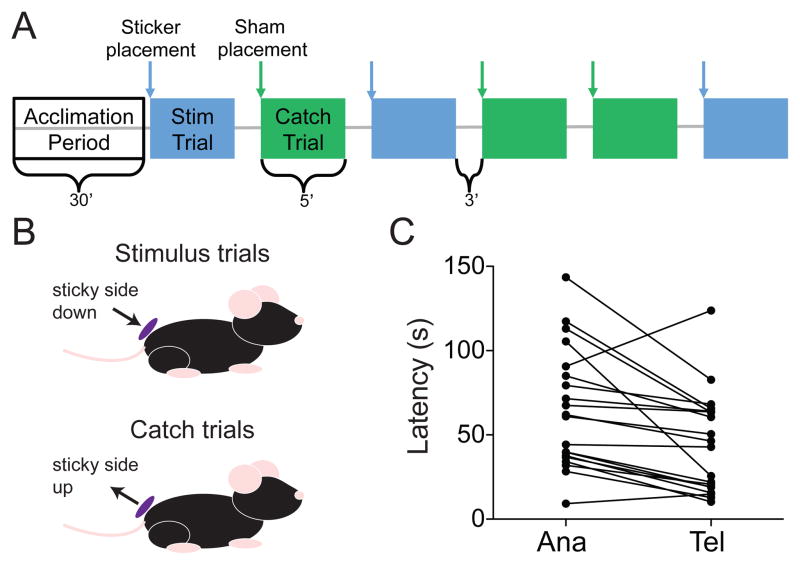
Figure 5. Behavioral touch responses are impaired during anagen.
(A) Behavioral testing paradigm. The order of stimulus (blue) and catch trials (green) was randomized. (B) Diagram of sticker placement. (C) Latency to sticker detection at each hair-cycle stage. Dots represent the mean latency for 3–6 trials per mouse. Lines connect latencies from individual mice (P=0.001; Wilcoxon matched-pairs signed rank test).

