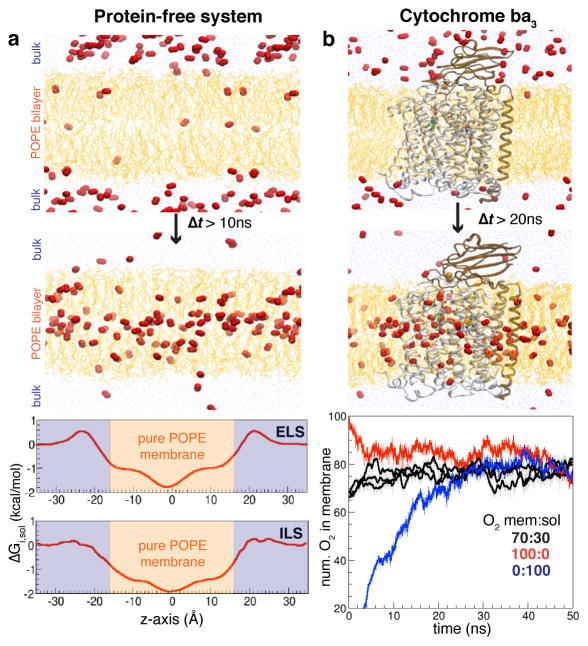
Figure 1. Partitioning profiles of O2 in membrane.
a) Distributions of O2 in membrane vs. aqueous phase in the protein-free system. Top panel illustrates the diffusion of O2 molecules (shown as red balls) from the aqueous phase to the membrane. O2 is considered to be in the membrane when either oxygen atom in the molecule is in between the C22 atoms (Cα of the palmitate’s ester) of the POPE lipids in the two leaflets (−16Å ≤ z ≤ 16Å). Partitioning free-energy profiles of O2 calculated from ELS simulations and ILS indicate that more O2 molecules reside in the membrane (shaded orange) than in the aqueous phase (shaded blue). b) A representative ELS simulation system in the presence of cytochrome ba3. All systems with different initial ratio of O2 show that O2 is more distributed in the membrane than in the aqueous phase.

