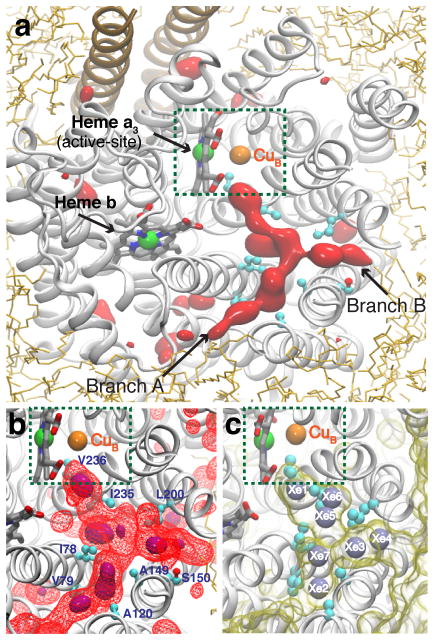
Figure 3. O2 delivery pathway of cytochrome ba3 identified by the ELS simulations.
All images were taken from the same top view of the enzyme. a) Highly occupied O2 regions characterized by the 3D density map calculated using the combined last 40-ns trajectories of five independent simulations. One region, which appears in a Y-shaped form, is the pathway that has been found to deliver O2 to the active site (green-dashed box). It is connected to the membrane via two branches, which we refer to and label as Branches A and B. Red-solid isosurfaces represent O2 partitioning free energy (ΔGi,sol) of −3.5 kcal/mol. b) The O2 delivery pathway. Purple-solid and red-wireframe isosurfaces correspond to ΔGi,sol of −4.0 and −3.0 kcal/mol, respectively. c) Xe binding sites identified by X-ray crystallography.35,40 Xe atoms were detected in a hydrophobic tunnel, displayed as a yellow-transparent surface using a probe radius of 1.8Å; they are numbered according to PDB entry 3BVD.35 The O2 delivery pathway identified in the present study (b) largely overlaps with this Xe-bound tunnel.

