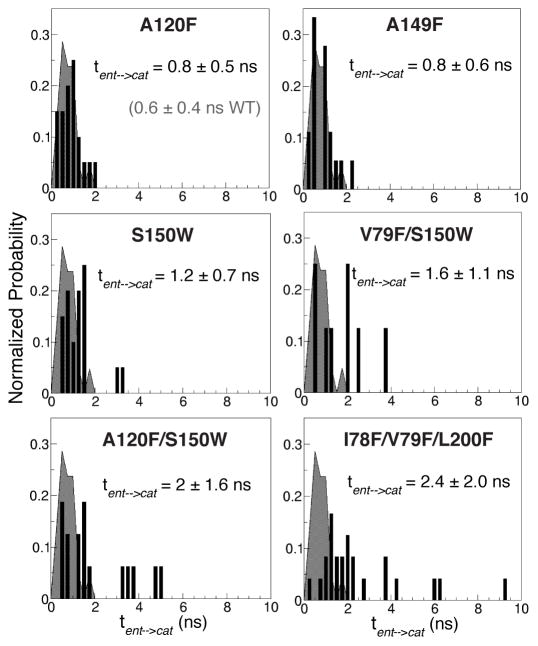
Figure 8. Migration profiles of O2 along the delivery pathway in the wild-type and mutants of cytochrome ba3 explicitly determined from multiple short ELS simulations.
tent→cat is the transit time of O2 from the entrances of the pathway to the active site. It is directly measured from the first delivered O2 molecule in each simulation. Histograms in each plot represent tent→cat distribution of a mutant. The shaded curved behind the bar histogram represents tent→cat distribution of the wild-type enzyme, providing a direct comparison with each mutant. tent→cat for the wild-type is 0.6±0.4 ns.

