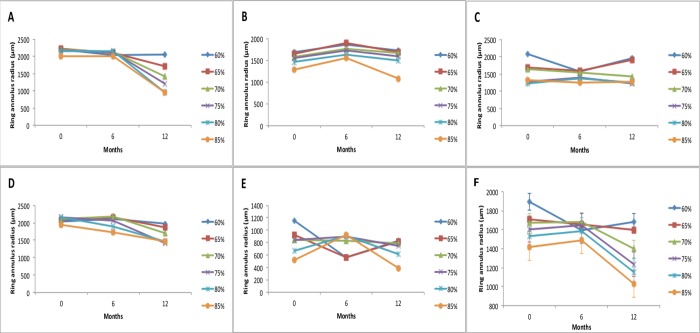
Figure 2.
A composite of ring annulus radius (μm) for each participant (A–E) at different percentile thresholds. The mean annulus radius for all participants is collated in (F) with error bars for the collated results. Note that irrespective of the percentile chosen, the same general trend is followed. In addition, the higher the percentile is set, the smaller the annulus radius.

