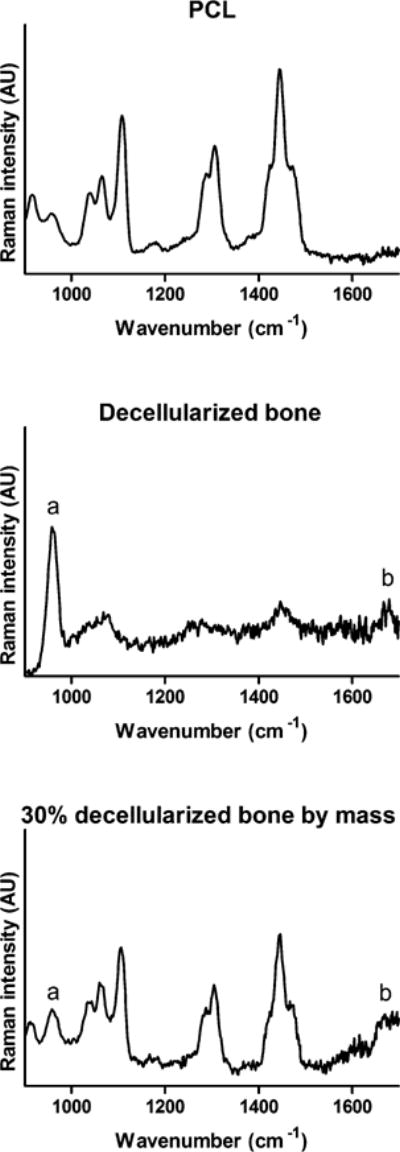
Figure 2.

Raman spectroscopy of pure and hybrid materials. Top: Raman spectra of pure polycaprolactone, revealing peaks at 1450 cm−1 for δCH2, 1300 cm−1 for ωCH2, and 1110 cm−1 for skeletal stretching. Middle: Raman spectra of decellularized trabecular bone, showing peaks at 960 cm−1 for phosphate (a) and 1650 cm−1 for collagen amide I (b). Bottom: Raman spectra of 30% DCB:PCL. The bone-only peaks as well as the peaks corresponding to contributions from both bone and polycaprolactone appear.
