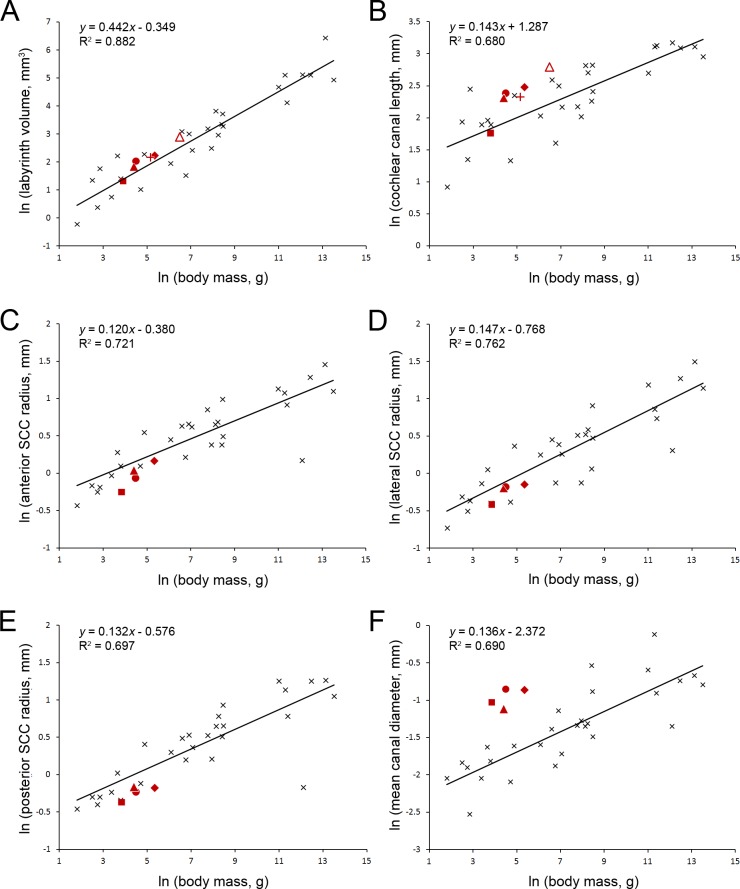
Fig 9. Relationships between inner ear measurements and body mass.
Relationships between the natural logarithms of inner ear measurements and body mass. Plot A considers the total volume of the bony labyrinth. Plot B considers the length of the cochlear canal. Plots C, D and E consider the radii of curvature of the anterior semicircular canal (SCC), lateral semicircular canal and posterior semicircular canal respectively. Plot F shows the mean cross-sectional diameter of all three semicircular canals. In each plot, data for 28 extant mammalian species (black crosses) were taken from Ekdale (2013), and a least squares regression line fitted as in that paper. Data-points representing mean values for bathyergids were superimposed as red symbols: Heterocephalus individuals over 100 days old (square), Bathyergus (open triangle), Cryptomys (solid triangle), Fukomys (circle), Georychus (diamond) and Heliophobius (plus). Body mass data, where available, were taken from Table 1 for the individual animals concerned. Unrecorded body masses were estimated as follows: Fukomys 89 g, a mean value for animals from the same laboratory colony [78]; Cryptomys 82 g, Georychus 211 g [79]. Inner ear data were taken from Tables 2 and 3.

