Figure 7.
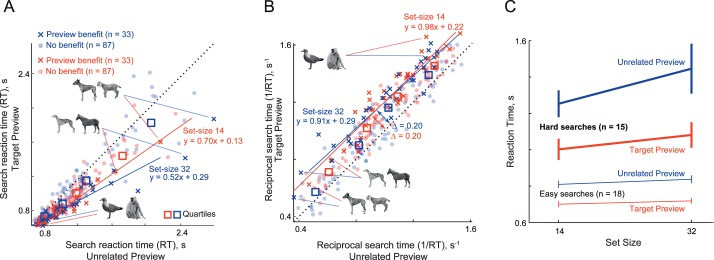
Effect of set size on target preview. (A) Search times in the target preview plotted against search times in the unrelated preview conditions for 14-item searches (red) and 32-item searches (blue). Plus symbols represent object pairs that showed a main effect of preview condition (p < 0.05, see text). Circles represent pairs with no significant difference (p > 0.05). Squares depict averaged data for search pairs corresponding to quartiles of the search time in the unrelated priming condition (set size 14). Red and blue lines indicate best-fitting straight lines to the significantly primed pairs. (B) Same data as in panel A but replotted using reciprocal search time (1/RT). All conventions are as in panel A. The symbol Δ represents the average salience benefit due to preview, i.e., the distance from the unit line. (C) Reaction time versus set size plot for the significant searches in hard (solid lines) and easy (dashed lines) groups divided according to the sorted RTs across 120 searches in the unrelated preview condition. There were 18 hard and 15 easy significant searches.

