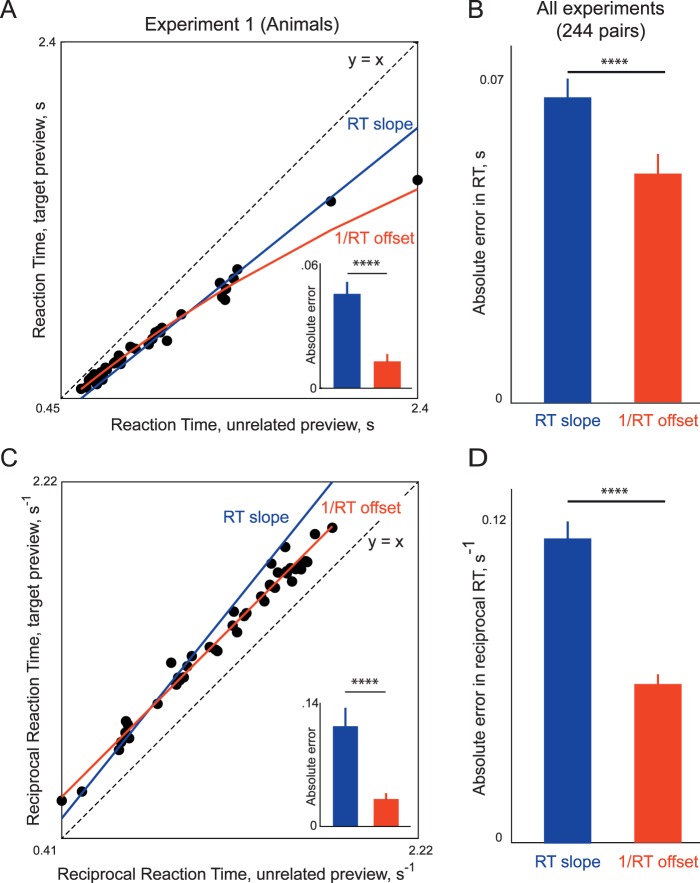
Figure 9.
Comparing RT scaling with 1/RT offset. (A) Search RTs for the target preview condition plotted against those in the unrelated preview conditions (black dots) with the best-fitting predictions of the RT slope model (blue) and the predictions of the 1/RT offset model (red) for searches that are significantly benefited by preview (n = 46). Inset: Mean absolute error for the RT slope model (blue) and 1/RT offset models (red). (B) Mean absolute error for the RT slope model (blue) and the 1/RT offset model (red) across all searches with a preview benefit across Experiments 1 through 8. This was calculated by combining the mean absolute error across experiments for each model. (C) Similar plot as in panel A but using 1/RT. (D) Similar plot as in panel B but using 1/RT, showing that the 1/RT offset model has a smaller error regardless of whether the error is measured using RT or 1/RT.

