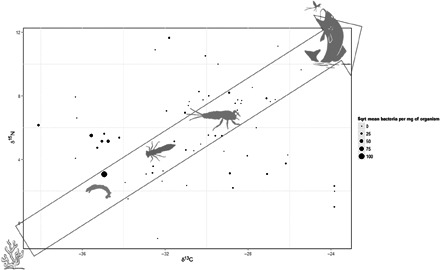
Fig. 1. The average δ15N and a low δ13C in biplot space for all recorded host and nonhost organisms from the 17 sites.

δ15N and δ13C were derived for each host taxon using data from the three sites analyzed for stable isotopic readings and extrapolated to the additional 14 sites. For each point, the square root–transformed mean number of M. ulcerans of the host is represented by the size of the circle.
