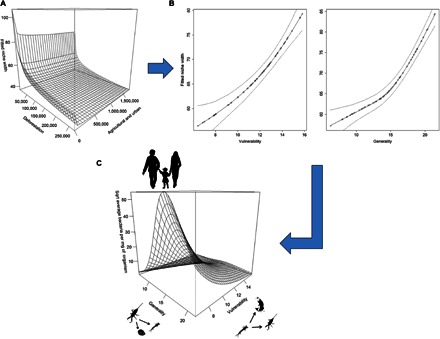
Fig. 2. Figure showing the relationships between land-use, deforestation and M. ulcerans.

(A) Plot showing the relationship between local site niche widths and the level of agricultural and urban landscape and deforestation in a 1-km buffer zone. The change in niche width caused by deforestation appears to be a steady decline, whereas the presence of agricultural land causes a sharp drop from where there is no agriculture, before exhibiting a similar steady decline in niche width as with deforestation, albeit less extreme. (B) Plot showing decline in vulnerability and generality as niche width declines with 95% confidence intervals. (C) Plot showing metrics of the food-web networks that allow taxa, which on average carry a higher M. ulcerans load to propagate. For all taxa, along the bottom axes are the mean regional food-web metrics for vulnerability and generality (that is, a measure of the food-web metrics of sites at which they are most abundant; see Materials and Methods for details), whereas the vertical axis shows the mean regional bacterial load of M. ulcerans.
