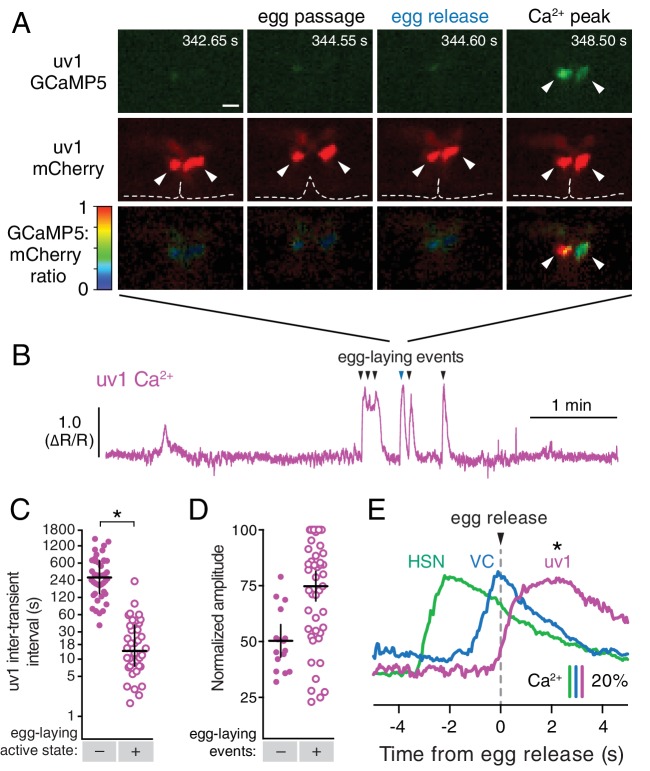
Figure 5. The tyraminergic uv1 neuroendocrine cells are mechanically deformed and activated by egg laying.
(A) Fluorescence micrographs of uv1 showing GCaMP5, mCherry, and the GCaMP5/mCherry ratio before egg laying, during egg passage through the vulva, and after egg release. Times of movie frames in seconds are at top, and white scale bar is 10 µm. Arrowheads in mCherry micrographs indicate position of uv1 cells as they are deformed by egg passage, the dotted line indicates position and opening of the vulva. (B) GCaMP5/mCherry ratio (∆R/R) trace of uv1 activity, including an egg-laying active state. Egg-laying events are indicated by arrowheads. (C) Scatter plots of uv1 inter-transient intervals during the inactive (closed circles) and active (open circles) egg-laying behavior states. Line indicates median, error bars indicate quartiles, and asterisks indicate significant differences (p<0.0001). (D) Scatter plots and medians of normalized amplitude with (+; open circles) and without (–; closed circles) an accompanying egg release. Error bars indicate quartiles, and asterisks indicate significant differences (p<0.0001, Mann-Whitney test). (E) uv1 Ca2+ transients follow egg-laying events. Normalized traces of median Ca2+ in HSN (green) and VC (blue) from Figure 1 are compared to uv1 (purple), synchronized to the moment of egg release (0 s, arrowhead and dotted line). Bars indicate 20% change in median GCaMP5/mCherry ratio. Asterisk indicates the uv1 Ca2+ peak is significantly later than the HSN and VC peaks (p<0.0001).

