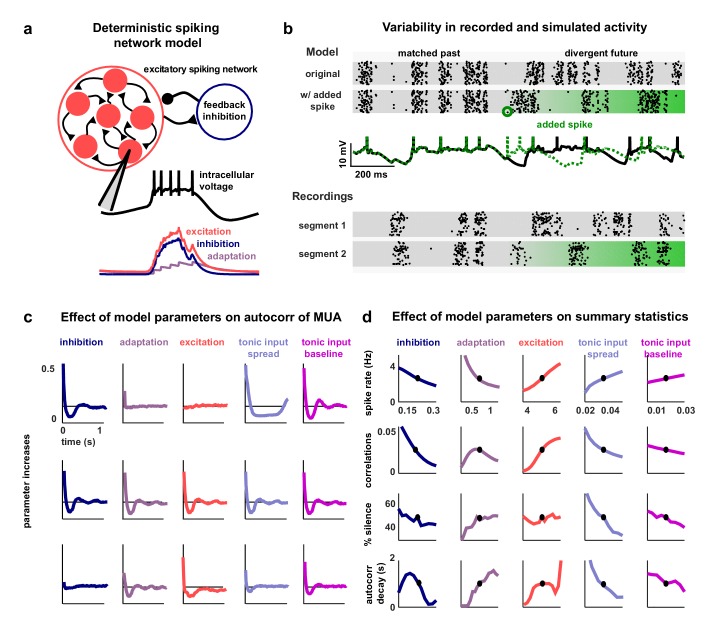
Figure 2. A deterministic spiking network model of cortical activity.
(a) A schematic diagram of our deterministic spiking network model. An example of a short segment of the intracellular voltage of a model neuron is also shown, along with the corresponding excitatory, inhibitory and adaptation currents. (b) An example of macroscopic variability in cortical recordings and network simulations. The top two multi-neuron raster plots show spontaneous activity generated by the model. By adding a very small perturbation, in this case one spike added to a single neuron, the subsequent activity patterns of the network can change dramatically. The middle traces show the intracellular voltage of the model neuron to which the spike was added. The bottom two raster plots show a similar phenomenon observed in vivo. Two segments of activity extracted from different periods during the same recording were similar for three seconds, but then immediately diverged. (c) The autocorrelation function of the MUA measured from network simulations with different model parameter values. Each column shows the changes in the autocorrelation function as the value of one model parameter is changed while all others are held fixed. The fixed values used were . (d) The summary statistics measured from network simulations with different model parameter values. Each line shows the changes in the indicated summary statistic as one model parameter is changed while all others are held fixed. Fixed values were as in panel c.


