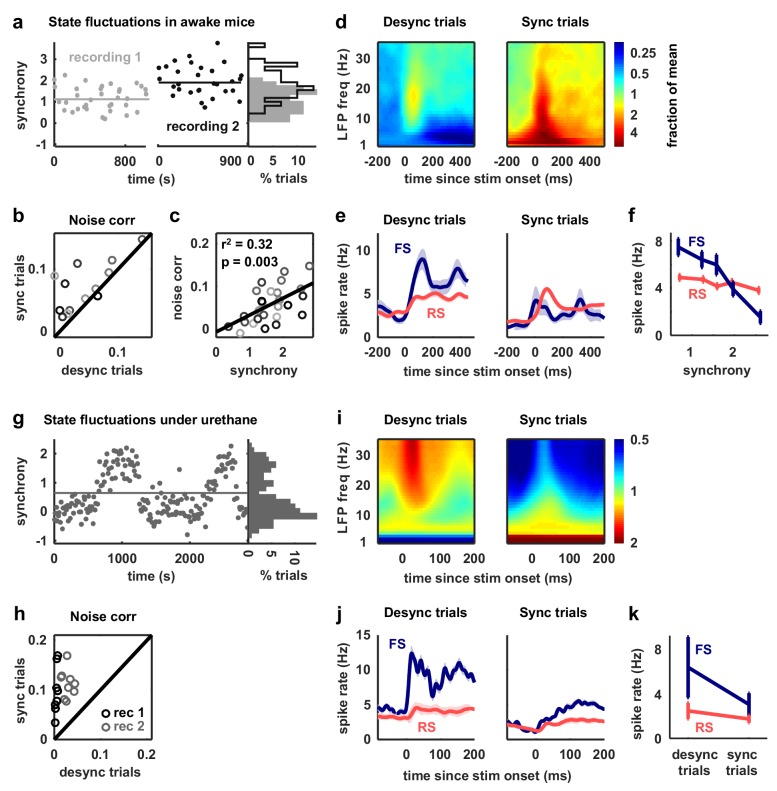
Figure 6. Fast-spiking neurons are more active during periods of cortical desynchronization with weak noise correlations.
(a) The cortical synchrony at different points during two recordings from V1 of awake mice, measured as the log of the ratio of low-frequency (3–10 Hz) LFP power to high-frequency (11–96 Hz). The distribution of synchrony values across each recording is also shown. The lines indicate the median of each distribution. (b) A scatter plot showing the noise correlations measured during trials in which the cortex was in either a relatively synchronized (sync) or desynchronized (desync) state for each recording. Each point indicates the mean pairwise correlations between the spiking activity of all pairs of neurons in one recording (after binning the activity in 15 ms bins). Trials with the highest 50% of synchrony values were classified as sync and trials with the lowest 50% of synchrony values were classified as desync. Values for 13 different recordings are shown. The Wilcoxon two-sided signed-rank test p-value was . (c) A scatter plot showing noise correlations versus the mean synchrony for trials with the highest and lowest 50% of synchrony values for each recording. Colors indicate different recordings. The Spearman rank correlation significance among all recordings was . (d) Spectrograms showing the average LFP power during trials with the highest (sync) and lowest (desync) 20% of synchrony values across all recordings. The values shown are the deviation from the average spectrogram computed over all trials. (e) The average PSTHs of FS and RS neurons measured from evoked responses during trials with the highest (sync) and lowest (desync) 20% of synchrony values across all recordings. The lines show the mean across all neurons, and the error bars indicate ±1 SEM. (f) The median spike rate of FS and RS neurons during the period from 0 to 500 ms following stimulus onset, averaged across trials in each synchrony quintile. The lines show the mean across all neurons, and the error bars indicate ±1 SEM. The Wilcoxon two-sided signed-rank test comparing FS activity between the highest and lowest quintile had a significance of and for RS activity, the significance was . (g) The cortical synchrony at different points during a urethane recording, plotted as in (a). The line indicates the value used to classify trials as synchronized (sync) or desynchronized (desync). (h) A scatter plot showing the noise correlations measured during trials in which the cortex was in either a synchronized (sync) or desynchronized (desync) state. Values for two different recordings are shown. Each point for each recording shows the noise correlations measured from responses to a different sound. The Wilcoxon two-sided signed-rank test between sync and desync state noise correlations had a significance of . (i) Spectrograms showing the average LFP power during synchronized and desynchronized trials, plotted as in (d). (j) The average PSTHs of FS and RS neurons during synchronized and desynchronized trials, plotted as in (e). (k) The median spike rate of FS and regular-spiking RS neurons during the period from 0 to 500 ms following stimulus onset during synchronized and desynchronized trials. The points show the mean across all neurons, and the error bars indicate ±1 SEM. The Wilcoxon two-sided signed-rank test comparing FS activity between the sync and desync had a significance of and for RS activity, the significance was .


