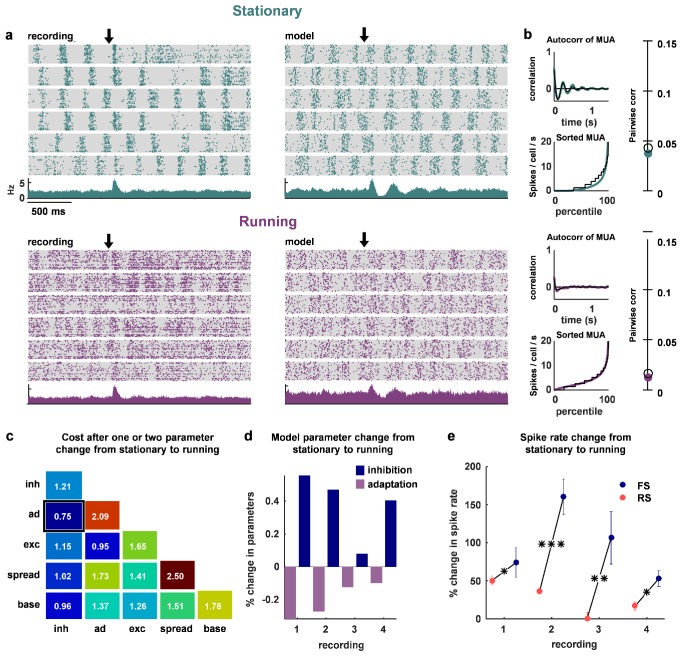
Figure 7. The change in dynamics during locomotion is best explained by an increase in inhibition and a reduction in adaptation.
(a) We recorded populations of neurons in head-fixed mice that were allowed to run on a treadmill. We obtained four separate recordings from two mice, which we divided into running and stationary epochs. The raster plots and PSTHs show evoked responses recorded of one example population when the animal was stationary (top) or running (bottom), along with the activity generated by the network model fit to each set of epochs. The units for the vertical axis on the PSTH are spikes / cell / s. The arrow indicates stimulus onset. (b) Model and data summary statistics for stationary (top) and running (bottom) epochs for one example population, plotted as in Figure 3. The model fits shown for running epochs were achieved by allowing two parameters (inhibition and adaptation) to change from fits to stationary epochs. (c) We fit our network model to activity from stationary epochs and investigated which changes in either one or two parameters best captured the change in dynamics that followed the transition to running. The best achieved cost with changes in each parameter (values along diagonal), or pair of parameters (values off diagonal), is shown (lower is better). (d) For the pair of parameters that best described the change in dynamics that followed the transition to running, model inhibition increased and adaptation decreased for each recording. (e) The spike rates of both FS and RS neurons were increased by running, but the relative increase was significantly larger for FS neurons in all four recordings (Wilcoxon rank-sum test, respectively). Across all recorded neurons, FS activity increased by 87% and RS activity increased by 28% during running (Wilcoxon rank-sum test, ).


