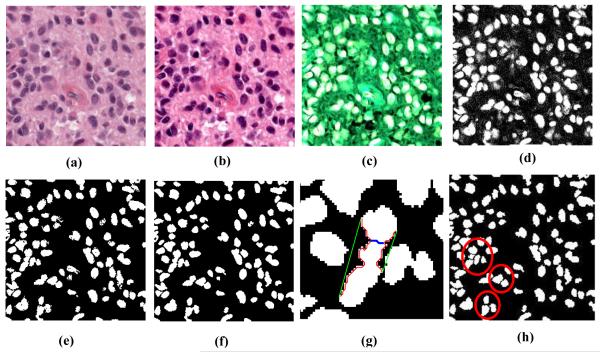
Figure 2.
Nuclei segmentation: (a) original image, (b) color normalized image, (c) Optical density image, (d) density of hematoxylin component, (e) hysteresis thresholding, (f) boundary smoothing of segmented nuclei (g) illustration of clustered nuclei separation; green (convex hull boundary), red (concave boundary), blue (cutting line found in a single iteration), (h) Final segmentation, clustered nuclei are separated (marked by red circle).

