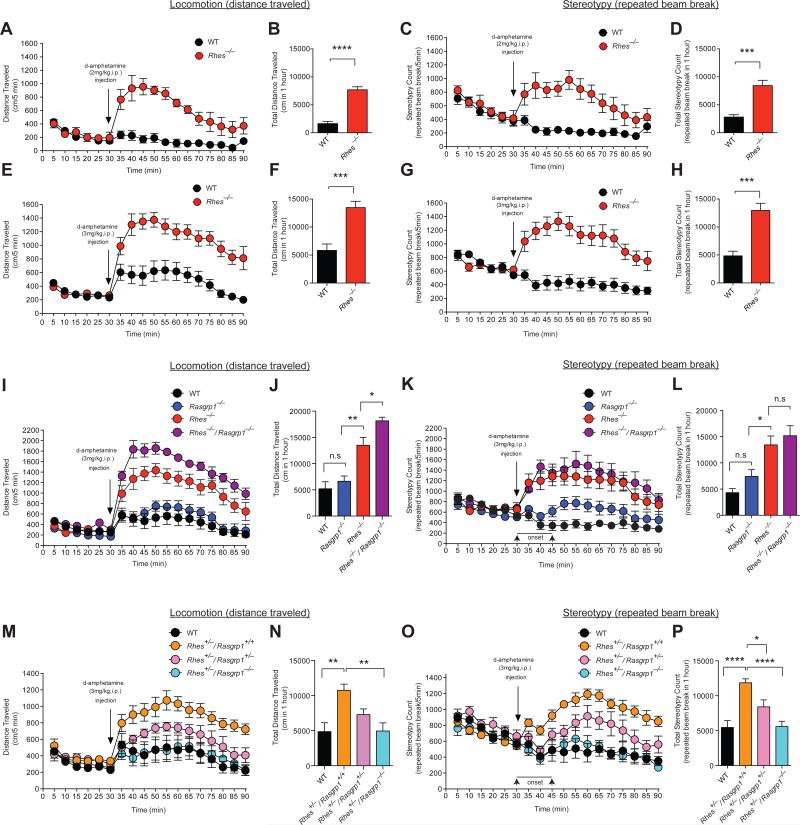
Figure 2. RasGRP1 inhibits Rhes to promote motor behavior.
(A-D) Motor behaviors in wild-type and Rhes−/− mice upon injection of 2mg/kg d-amphetamine (i.p. at 10μl/g). n=6 wild-type (2 female), n=4 Rhes−/− mice (2 female). (A) Distance (cm) traveled per 5 min. F value for genotype: F(1,8)=56.27, p<0.0001; for time: F(17,136)=9.575, p<0.0001; and for time x genotype interaction: F(17,136)=9.564, p<0.0001. (B) Total distance (cm) traveled in 1 hour.****p<0.0001 by a Student's t-test. (C) Stereotypy count (repeated beam breaks) per 5 min. F values, listed as in (A): F(1,8)=33.93, p=0.0004; F(17,136)=4.869, p<0.0001; and F(17,136)=5.193, p<0.0001. (D) Total stereotypy count in 1 hour. ***p=0.0003 by a Student's t-test. (E-H) As in (A-D) in mice injected with d-amphetamine (3mg/kg i.p. at 10μl/g); n=8 wild-type, n=8 Rhes−/− mice. F values, listed as in (A): for (E) F(1,14)=21.69, p=0.0004; F(17,238)=28.88, p<0.0001; and F(17,238)=9.496, p<0.0001; and for (G) F(1,14)=25.37, p=0.0002; and F(17,238)=3.939, p<0.0001; and F(17,136)=11.63, p<0.0001. (F) ***p=0.0003; (H) ***p=0.0001, by a Student's t-test. (I-L) As in (A-D) in wild-type, Rasgrp1−/−, Rhes−/−, Rhes−/−/Rasgrp1−/− mice upon injection of 3mg/kg d-amphetamine (i.p. at 10μl/g); n=6 wild-type, n=7. Rasgrp1−/−, n=6 Rhes−/−, n=6 Rhes−/−/Rasgrp1−/− mice. F values, listed as in (A): for (I) F(3,21)=30.13, p<0.0001; F(17,357)=65.94, p<0.0001; and F(51,357)=8.428, p<0.0001; and for (K) F(3,21)=11.63, p=0.0001; F(17,357)=8.980, p<0.0001;and F(51,357)=5.545, p<0.0001. P values were (J) *p=0.049, **p=0.0019; (L) *p=0.035; n.s., not significant. (M-P) As in (A-D) in wild-type, Rhes+/−/Rasgrp1+/+, Rhes+/−/Rasgrp1+/−, Rhes+/−/Rasgrp1−/− mice upon injection of 3mg/kg d-amphetamine (i.p. at 10μl/g); n=6 wild-type, n=8 Rhes+/−/Rasgrp1+/+, n=6 Rhes+/−/Rasgrp1+/−, n=6 Rhes+/−/Rasgrp1−/− mice. F values, listed as in (A): (M) F(3,22)=7.591, p=0.0012; F(17,374)=22.11, p<0.0001; and F(51,374)=3.214, p<0.0001; and for (O) F(3,22)=11.34, p=0.0001; F(17,374)=10.48, p<0.0001; and F(51,374)=5.630, p<0.0001. P values were (N) **p=0.0027; (P) *p<0.026, ****p<0.0001. Data are mean ± SEM, n indicated in each panel's legend. F-values in (A, C, E, G, I, K, M, and O) were calculated by two-way repeated measures (mixed model) ANOVA followed by a post hoc Bonferroni multiple comparison tests. Two-way multiple comparisons were significant, but were not included in the figures to keep the presentation clean. P values in (J, L, N, and P) were calculated by one-way ANOVA followed by a post hoc Tukey's multiple comparison tests.

