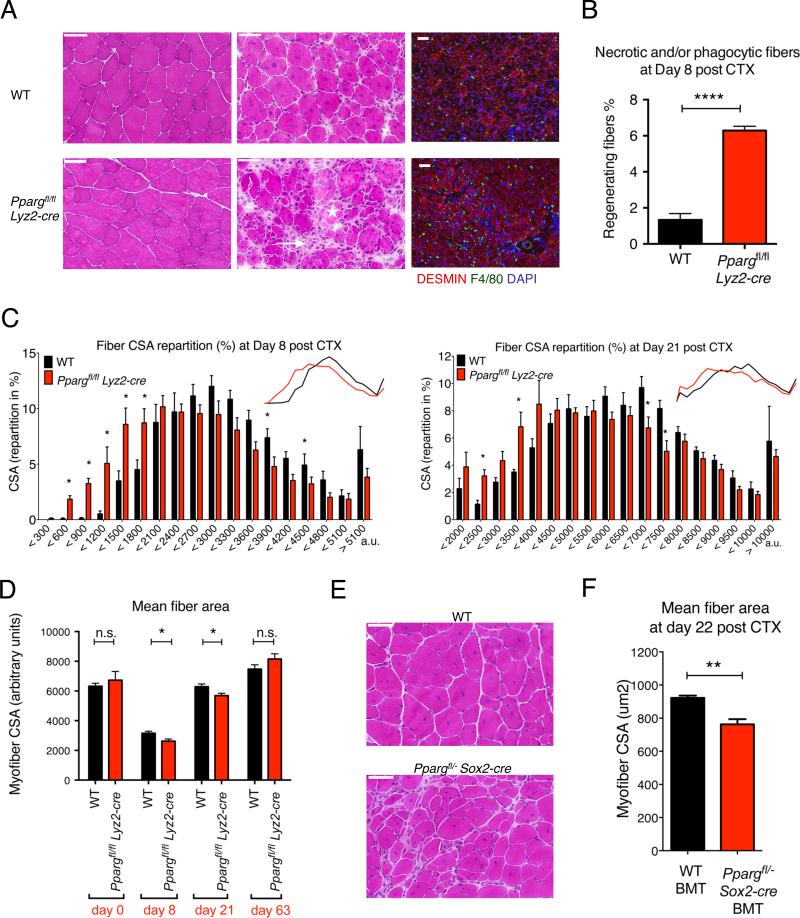
Fig 1. Impaired regeneration of skeletal muscle in PPARγ deficient animals.
(A) Representative images of HE stained skeletal muscle from WT and Ppargfl/fl Lyz2-cre animals prior (day 0) or post CTX induced injury (day 8) are shown. Asterisk labels phagocytic and/or necrotic fibers and arrow points to foci of inflammatory infiltrations. IHC detection of desmin (red), F4/80 (green) and nuclei (blue) at day 8 post CTX injury is also shown. Scale bars in the upper left represent 50 μm. (B) The ratio of phagocytic and/or necrotic fibers relative to all regenerative fibers at day 8 of regeneration in WT and Ppargfl/fl Lyz2-cre muscle sections is shown. (C) Fiber size repartition of regenerating muscle in WT or Ppargfl/fl Lyz2-cre animals at day 8 and day 21 post CTX injury. (D) Average fiber cross section area (CSA) of regenerating muscle at indicated timepoints post CTX injury in WT and Ppargfl/fl Lyz2-cre animals. (E) Representative images of HE stained skeletal muscle 22 days after CTX injury from bone marrow transplanted (BMT) animals that received either WT or Ppargfl/− Sox2-cre bone marrow. n=4 or 4, 5 or 6, 5 or 5 and 5 or 5 muscles for WT or Ppargfl/fl Lyz2-cre mice, respectively, at day 0, 8, 21 and 63. (F) Muscle fiber CSA of BMT animals 22 days post CTX injury. n= 8 muscles for both genotypes. In all bar graphs, mean values +/− SEM are shown. For Pparg expression in macrophages and CD45+ cells and for additional histological analysis, see Fig S1 and S2. For the FACS analyses of infiltrating cells see Fig S3.

