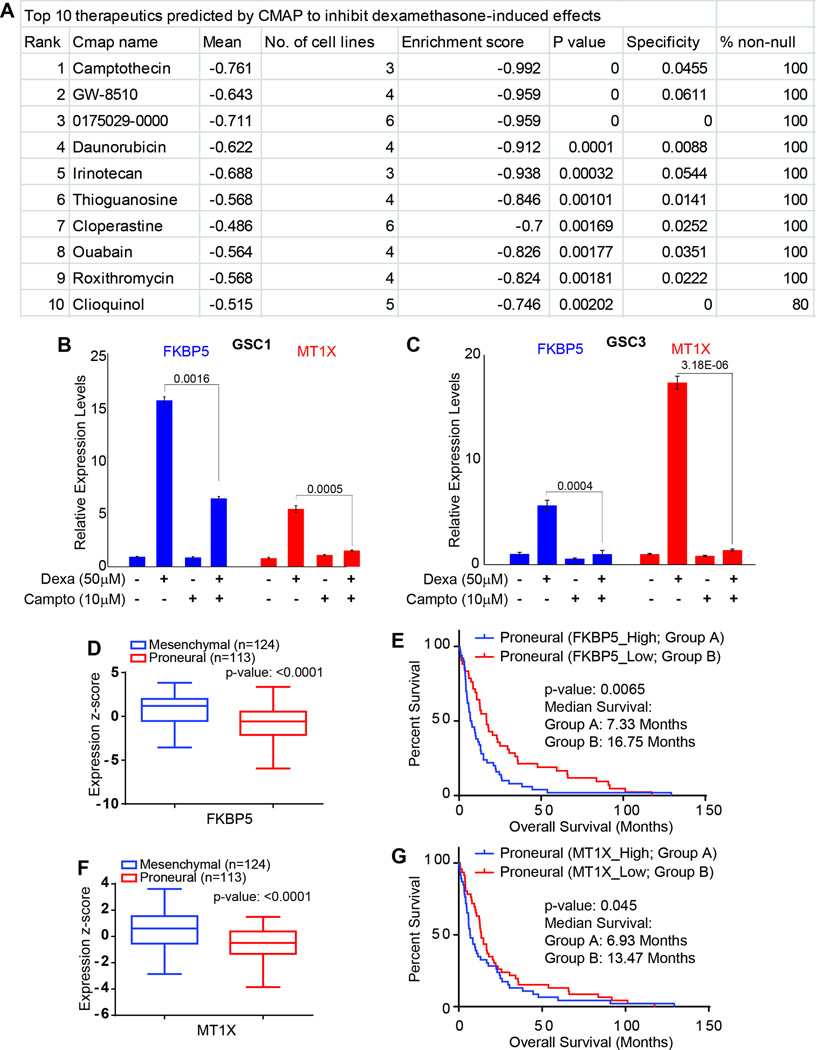
Figure 5.
Identification and validation of camptothecin as neutralizer of dexamethasone induced effects in GSC. (A) A list of top ten therapeutics identified by connectivity map analysis based on dexamethasone induced genomic profiles. The ranking was automatically calculated, respecting mean observed values, number of cell lines available in the database, enrichment score, P-value, specificity, and percentage of non-null results. (B and C) In vitro exposure of GSCs with 10 µM Camptothecin and 50 µM dexamethasone (alone and in combinations), relative expression levels of FKBP5 and MT1X, two representative genes of the dexamethasone-induced oncogenic gene network in GSC1 and 3. P-values are displayed above the compared samples in each graph. (D and F) Expression of FKBP5 and MT1X in mesenchymal and proneural sub-groups of GBM patients in TCGA database. (E and G) Kaplan-Meier curve analysis of the proneural TCGA glioblastoma cohort (n=113). (E) Median survival of proneural glioblastoma patients with a high FKBP5 expression is 7.33 months, whereas that of patients with a low FKBP5 expression is 16.75 months (P = 0.0065). (G) Median survival of proneural glioblastoma patients with a high MT1X expression is 6.93 months, whereas that of patients with a low MT1X expression is 13.47 months (P = 0.045).

