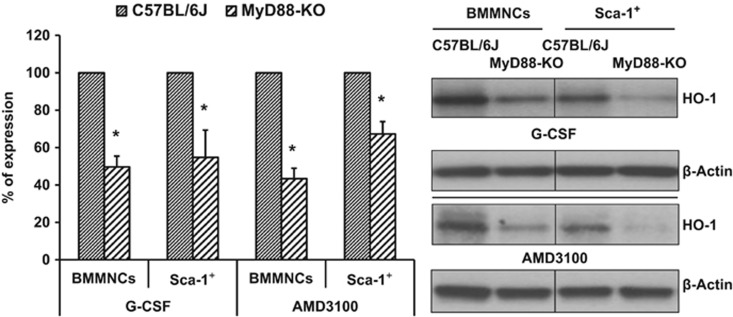
Figure 2.
The level of HO-1 was evaluated in BMMNCs, and sorted Sca-1+ cells collected from WT and MyD88-KO mice were stimulated with G-CSF (140 ng/ml) or AMD3100 (140 ng/ml). Left panel: expression of HO-1 at the mRNA level by real-time PCR. Results from three independent experiments are pooled together and shown as the percentage of expression in WT mice. *P⩽0.05. Right panel: expression of HO-1 by western blotting in BMMNCs and Sca-1+ cells purified from WT and MyD88-KO mice. As shown here, the cells from MyD88-KO mice show downregulation of HO-1 compared with WT-derived cells. The experiment was carried out twice with similar results, and a representative blot is shown.

