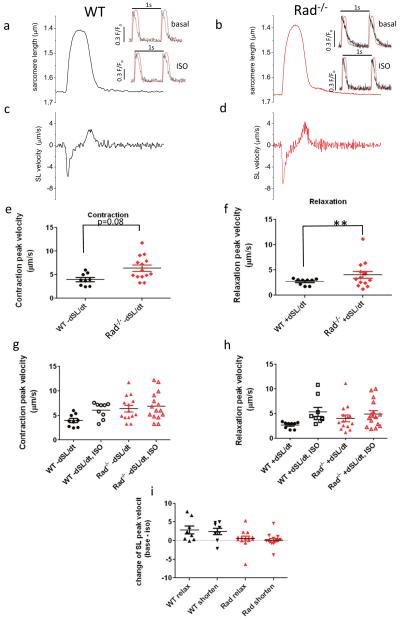
Fig. 5.
Rad−/− sarcomere dynamics is faster, and Rad−/− basal SL kinetics is indistinguishable from ISO stimulated WT SL kinetics (ceiling effect). a Representative SL trace for one beat from WT and b from Rad−/− cardiomyocyte. Cells were paced to steady state at 1 Hz. 1 s total time showed. c 1 s derivative of SL for WT and d for Rad−/−. Inset: normalized superimposed Ca2+ transient and SL traces. Scale bar = 0.3 fluorescence units for Ca2+ transient, SL trace from main panel normalized to peak Ca2+. No time scale bar, the peak to peak interval is 1 s. e Pooled peak SL velocity for contraction and f for relaxation. **p < 0.001. g, h ISO speeds sarcomere relaxation velocity (A) and contraction velocity (B) in WT. See Table 1 for statistical analysis of panels a and b. i Pooled data of ISO difference for each cardiomyocyte. t test for difference = 0 was significant for WT for relaxation and contraction in WT but not significant for Rad−/−. *p < 0.02

