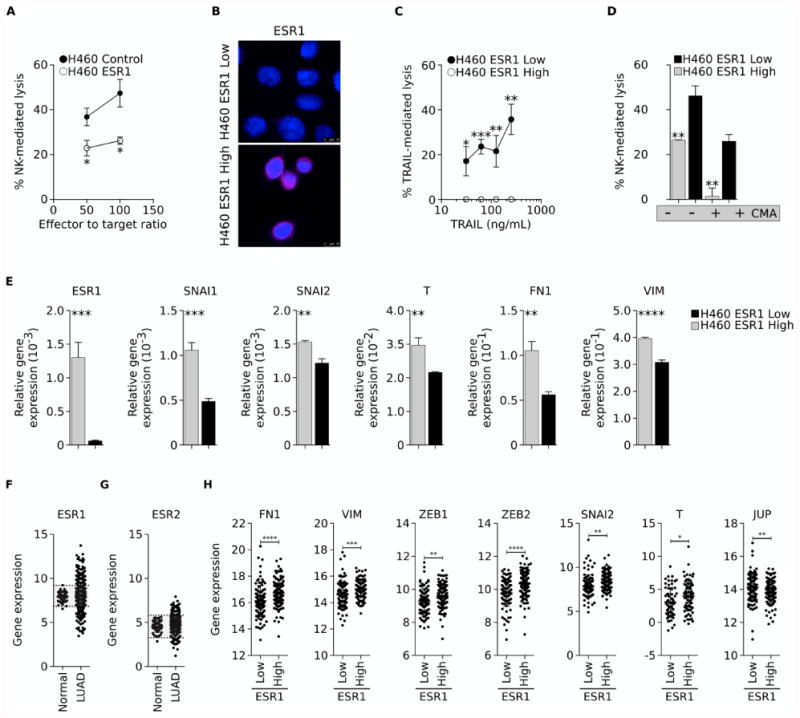
Figure 5. Estrogen receptor mediates resistance to immune attack.

(A) H460 cells stably transfected with pCMV or a vector encoding the ESR1 gene were assessed for their sensitivity to NK-mediated lysis. (B) Immunofluorescent analysis of ESR1 expression (pink signal) in single cell clones of H460 cells with High vs. Low ESR1 expression. Blue signal corresponds to DAPI staining. (C) Clones were evaluated for their susceptibility to lysis by TRAIL (C) or NK cells that were either untreated or pre-treated with CMA to inhibit perforin-dependent lytic pathways (D). (E) Relative expression of indicated mRNA in clonal H460 ESR1-High vs. ESR1-Low cells. (F) ESR1 and (G) ESR2 mRNA in normal lung vs. lung adenocarcinoma (LUAD) tissues. Shaded areas correspond to the normal range of expression for each gene, calculated as the mean expression in normal lung tissues (± two standard deviations). (H) mRNA expression of indicated genes in lung samples categorized as either ESR1 Low or High, based on the expression in normal lung tissues. Error bars indicate the standard deviation of the mean. [* p<0.05, ** p<0.01, *** p<0.001, **** p<0.0001].
