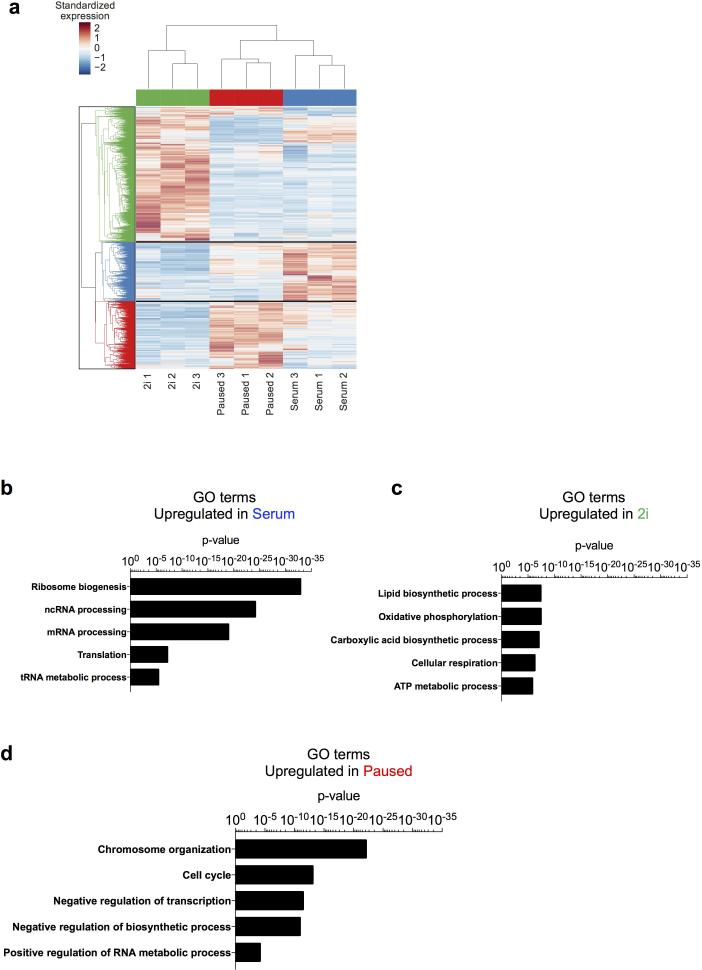
Extended Data Figure 8.
Distinct functional annotations are associated with different states of ES cells. a, Clustering of dynamically expressed genes. Heatmap shows 3864 dynamically expressed genes (differentially expressed between any two of the 2i, serum, and paused states and mean FPKM > 10 in at least one state). The FPKM value of each gene was standardized across the 9 samples by subtracting the mean and then dividing by the standard deviation. Hierarchical clustering was performed using the standardized expression values using Euclidean metric and average linkage. b-d, Selected GO terms enriched in the annotations of genes upregulated in serum (a), 2i (b) or paused (c) ES cells. See Supplementary Table 3 for complete list of significant GO terms associated with each ES cell state.

