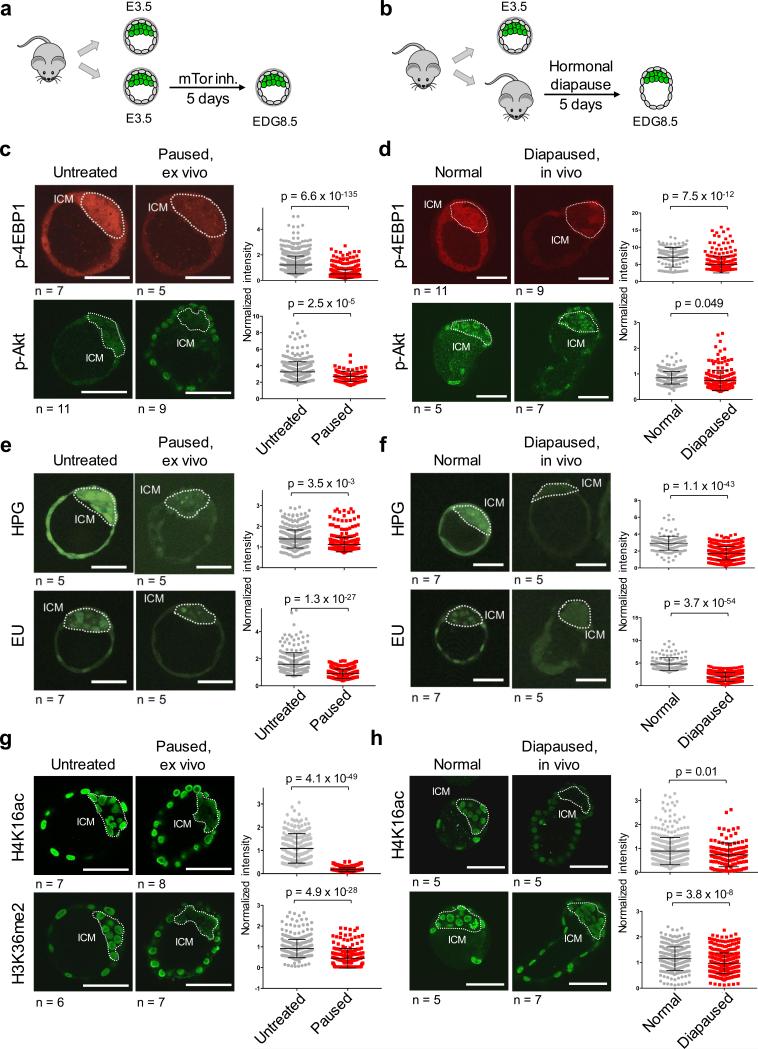
Figure 2.
Ex vivo paused blastocysts and in vivo diapaused blastocysts have similarly suppressed cellular functions. a-b, Workflow of the generation of ex vivo paused (a) and in vivo diapaused (b) blastocysts at EDG8.5. c-h, Ex vivo paused (c, e and g) and in vivo diapaused blastocysts (d, f and h) were stained for the indicated markers. c-d, Phospho-4EBP1 phosphorylation and Phospho-Akt; e-f, nascent translation (EU) or transcription (HPG); g-h, H4K16ac and H3K36me2. Representative images are shown. ICM is marked with dashed lines based on Oct4 staining. Each ICM cell was quantified and pooled data from embryos were plotted in adjacent graphs. n=number of embryos. Values represent mean±SD. P-values are from two-tailed unpaired student's t-test. Scale bars = 50 μm.

