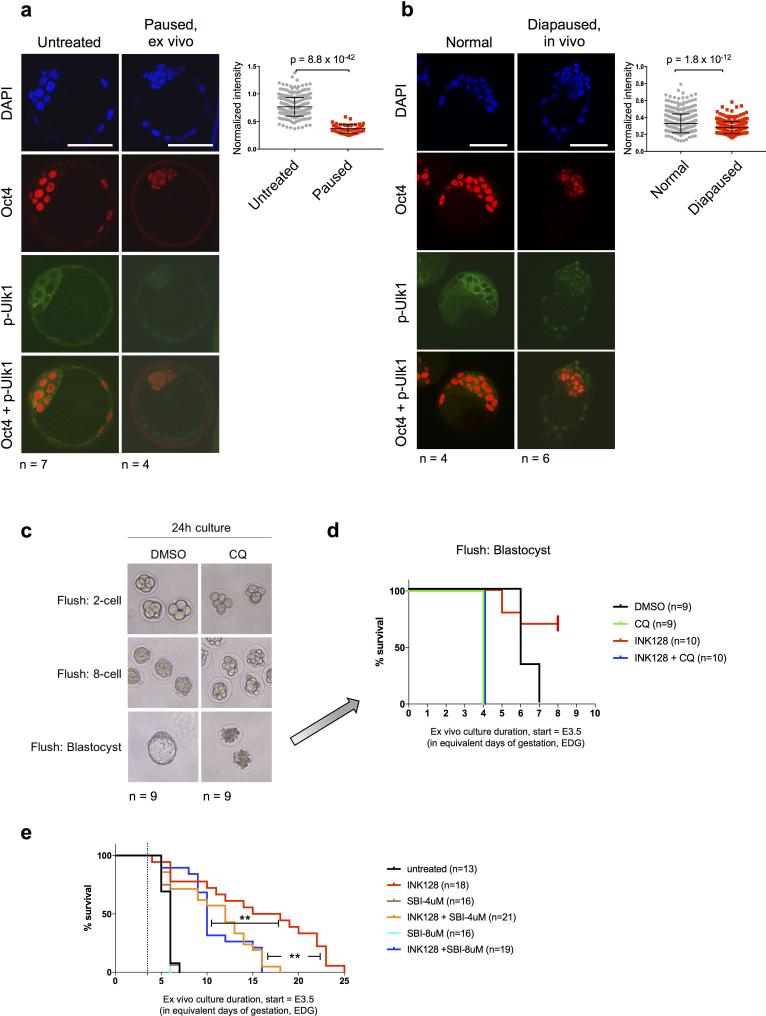
Extended Data Figure 4.
Paused blastocysts show signs of autophagy. a, Immunofluorescence images of phosphorylated Ulk1 in untreated vs. paused (a), or normal vs. diapaused (b) embryos. Oct4 staining is shown as a marker of the ICM. Scale bar = 50 μm. The number of embryos analyzed (n) is indicated. Error bars indicate standard deviation. P-values are from two-tailed unpaired student's t-test. c, Images showing embryos retrieved at different developmental stages incubated with the autophagy/lysosomal inhibitor chloroquine (CQ) for 24 hours. The number of embryos analyzed (n) is indicated. d, Kaplan-Meier survival curves of blastocysts cultured with chloroquine in the presence or absence of the mTor-inhibitor INK128. CQ treatment leads to blastocysts collapse, as previously reported37. The experiment was terminated at EDG8.5. e, Kaplan-Meier survival curves of blastocysts cultured with the autophagy/Ulk1 inhibitor SBI-0206965 in the presence or absence of the mTor inhibitor INK128. Inhibition of Ulk1 leads to decreased survival of paused blastocysts. **=P-value<0.01 from log-rank (Mantel-Cox) test. Dotted lines indicate the time of blastocyst flushing (E3.5).

