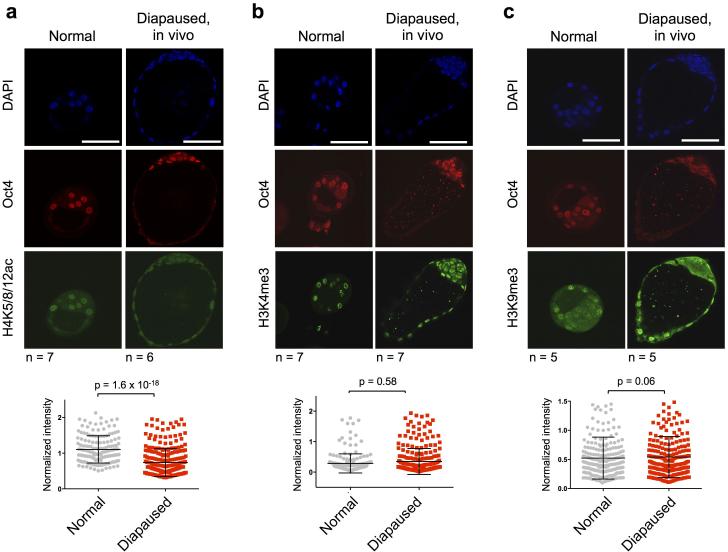
Extended Data Figure 5.
In vivo diapaused blastocysts have reduced histone H4 acetylation. a-c, Immunofluorescence images and quantification at the single ICM cell level of normal vs. in vivo diapaused blastocysts for H4K5/8/12ac (a), H3K4me3 (b) and H3K9me3 (c) levels. Oct4 staining is shown in all cases as a marker of the ICM. Scale bar = 50 μm. The number of embryos analyzed (n) is indicated. Graphs show data pooled from all embryos. Error bars indicate standard deviation. P-values are from two-tailed unpaired student's t-test.

