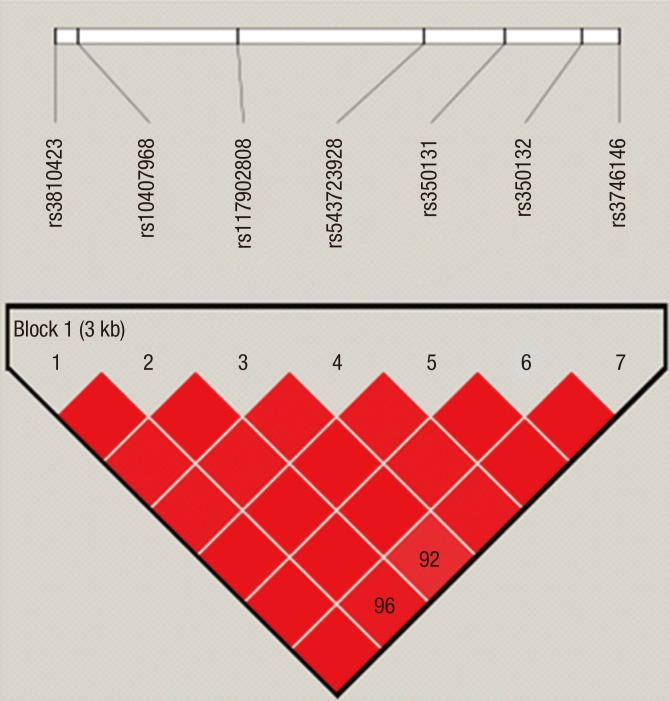
Fig. 1.
LD plot for 7 SNPs in the KISS1R gene. The D′ values that correspond to each SNP pair are expressed as a percentage and shown within the respective square. Squares without numbers represent D′ values of 1.0, indicative of complete LD. The 7 SNPs constitute one haplotype block (Block 1).
LD = linkage disequilibrium, KISS1R = kisspeptin receptor, D′ = linkage disequilibrium coefficient, SNP = single-nucleotide polymorphism.

