Fig. 2.

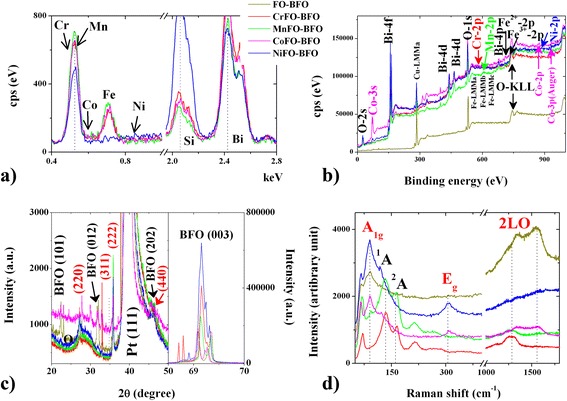
a SEM–EDS, b XPS, c XRD and d Raman curves of XFO–BFO membranes. The curves are FO–BFO (yellow), CrFO–BFO (red), MnFO–BFO (green), CoFO–BFO (violet), and NiFO–BFO (blue)

a SEM–EDS, b XPS, c XRD and d Raman curves of XFO–BFO membranes. The curves are FO–BFO (yellow), CrFO–BFO (red), MnFO–BFO (green), CoFO–BFO (violet), and NiFO–BFO (blue)