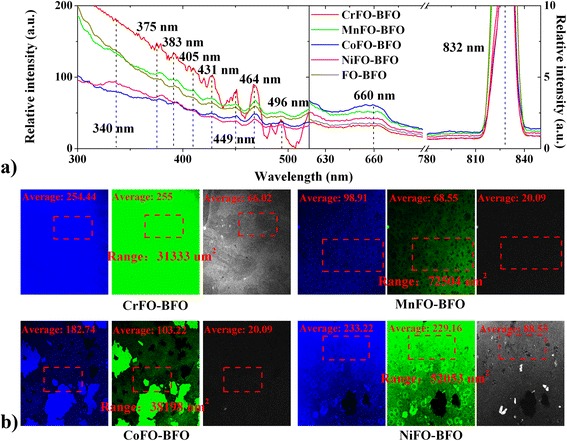
Fig. 3.

a Fluorescence spectra and b images of XFO–BFO membranes. Therein, the excitation wavelength of a fluorescence spectra are 250 (left) and 550 (right) nm, respectively. The main emission peaks at 340–431 nm (green) and 449–496 nm (green and blue) correspond to the intrinsic blue and green emission of octahedral Fe3+–O2− (XFO and BFO) orbitals and tetrahedral Fe2+–O2− (XFO) orbitals, respectively. The excitation wavelengths of b fluorescence microscopies are 405 (green), 488 (blue), and 635 (gray) nm
