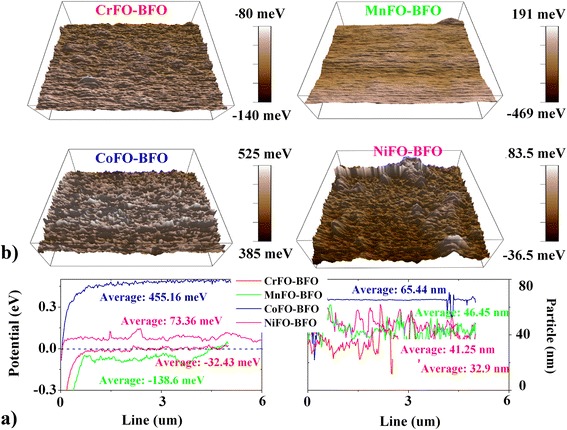
Fig. 5.

a Surface potential images and b the relative potential curves of XFO–BFO membranes by AFM–KPFM measurement. Therein, the scanning area is 5 μm × 5 μm. The particles are essentially in agreement with the differences of grain sizes in SEM images
