
Figure 2.
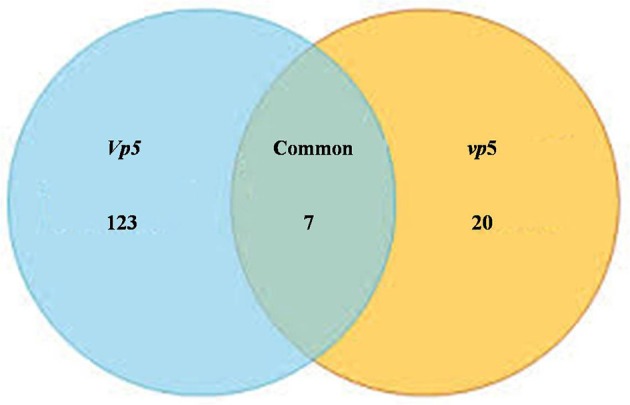
Venn diagram showing the number of significantly expressed proteins in maize leaves under drought stress. The diagram shows the overlap between the ABA-deficient mutant vp5 and the wild-type Vp5.
Official websites use .gov
A
.gov website belongs to an official
government organization in the United States.
Secure .gov websites use HTTPS
A lock (
) or https:// means you've safely
connected to the .gov website. Share sensitive
information only on official, secure websites.
Venn diagram showing the number of significantly expressed proteins in maize leaves under drought stress. The diagram shows the overlap between the ABA-deficient mutant vp5 and the wild-type Vp5.