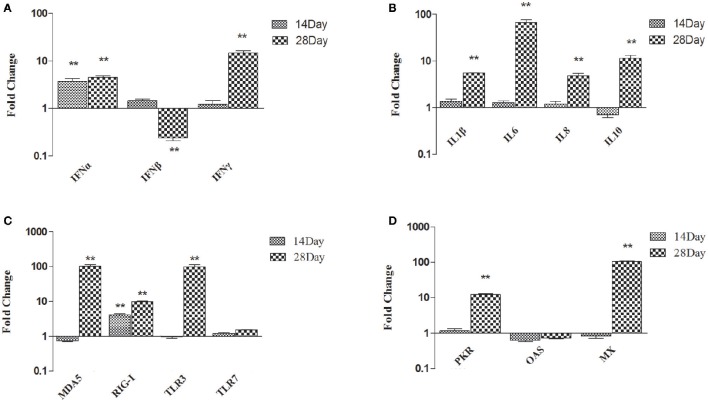
Figure 1.
Expression profiles of immune-related genes in the thymus of ducks. (A) IFN-α, IFN-β, and IFN-γ (B) IL-1β, IL-6, IL-8, and IL-10 (C) MDA5, RIG-I, TLR3, and TLR7 (D) PKR, OAS, and MX. The Y axis represents the fold change in target gene expression in DFM than that of control group. Data were expressed as means ± standard deviations (n = 5). Differences were detected with Student's t test and were considered significant as follows: **P < 0.01.

