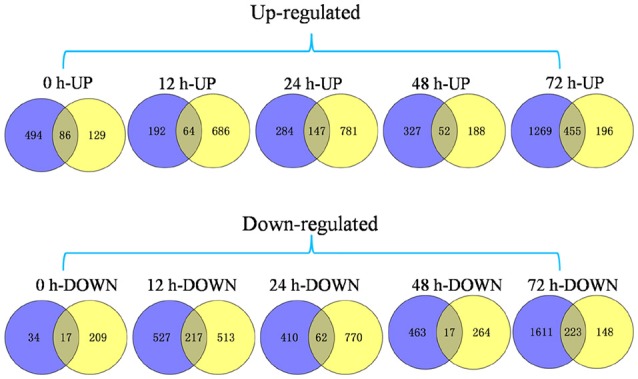
Figure 4.

Venn diagram of DEGs in the Pi21-RNAi line compared with Nip within 72 hpi. A set of 1109 genes exhibited significant differential expression between two genotypes infected with both isolates. We identified 103 (86 up-regulated and 17 down-regulated) DEGs, 281 (64 up-regulated and 281 down-regulated) DEGs, 209 (147 up-regulated and 62 down-regulated) DEGs, 69 (52 up-regulated and 17 down-regulated) DEGs, and 678 (455 up-regulated and 223 down-regulated) DEGs in the Pi21-RNAi line at 0, 12, 24, 48, and 72 hpi compared with that in Nip, respectively. Blue represents DEGs between two genotypes infected with GUY-11. Yellow represents DEGs between two genotypes infected with TMC-1.
