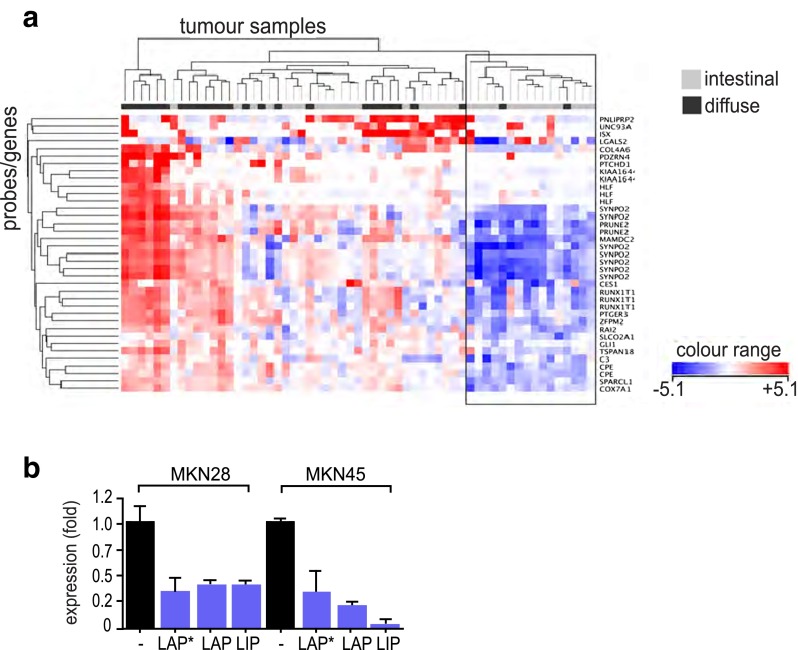
Fig. 3.
a Cross-species comparison of gene expression. Two-way hierarchical clustering was performed on the human gastric cancer samples using a strongly regulated gene cluster (shown in Supplementary Fig. 2) from microarray-derived genes that differed between murine C/EBPβ KO and WT stomach (p ≤ 0.01, FC ≥ 1.5). Depicted are the resultant gene and sample dendrograms and the corresponding expression intensity heatmap. The black box indicates a tumor cluster in which most of the genes show down-regulation (bluish spots). This tumor group consisted of 16 of the original 59 (≈27 %) samples and contained primarily cancers of the intestinal histological type. b Transfection of C/EBPβ isoforms LAP*, LAP, and LIP into gastric cell lines MKN28 and MKN45 repressed RUNX1t1 expression as measured by quantitative PCR. All bar graphs represent the result of at least three independent measurements; asterisk indicates p < 0.001

