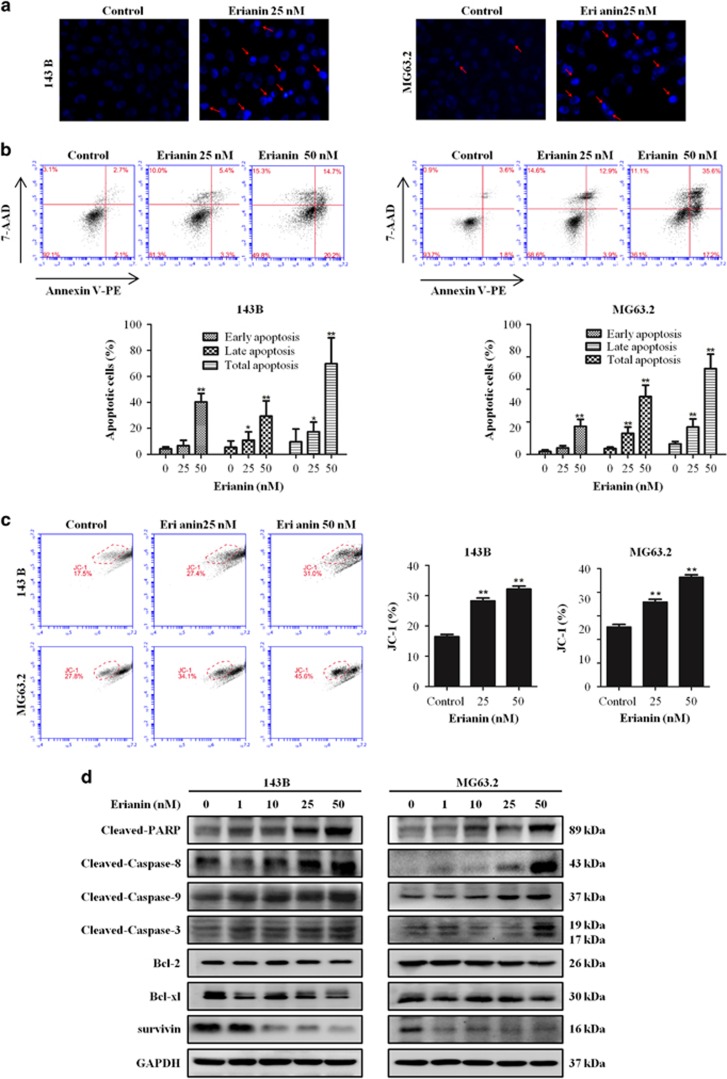
Figure 2.
Erianin induces apoptosis in OS cells. (a) Apoptotic nuclear morphology changes induced by erianin were assessed by Hoechst 33342 staining and visualized by fluorescence microscopy. Arrows indicate chromatin condensation and nuclear fragmentation. (b) Cells were treated with increased concentrations of erianin for 24 h. Cells were processed by flow cytometry using Annexin V-PE/7-AAD (7-aminoactinomycin D) staining and analyzed by flow cytometry. The histograms indicate that the percentage of early apoptosis, late apoptosis, and total apoptosis. The percentage of apoptosis cells is shown as mean±S.D. from three independent experiments. (c) The mitochondrial membrane potential after erianin treatment were measured using JC-1 staining by flow cytometry. The histograms indicate the ratio of green in JC-1 fluorescence. Results are shown as mean±S.D. from three independent experiments. (d) 143B and MG63.2 cells were incubated with erianin for 24 h. Cell lysates were prepared and analyzed by western blotting for cleaved PARP, caspase-8, -9, and -3, Bcl-2, Bcl-xl, and survivin. *P<0.05 and **P<0.001, significantly different compared with control

