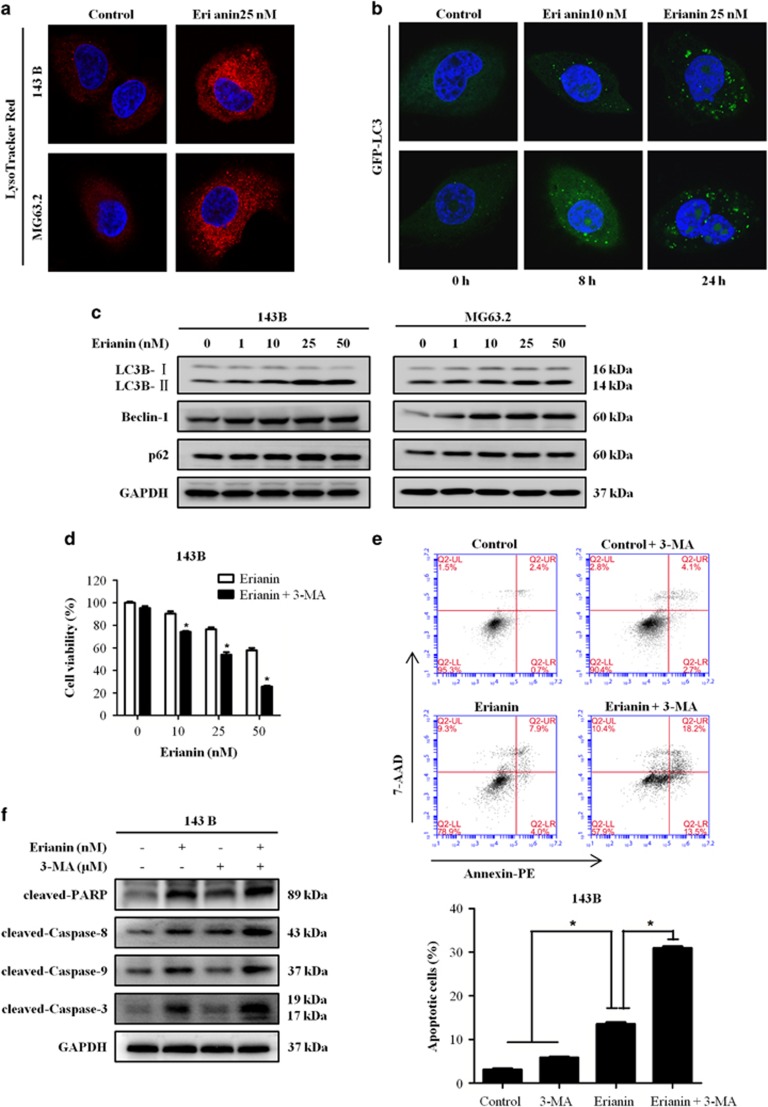
Figure 3.
Erianin induces autophagy and inhibition of autophagy increases erianin-induced apoptosis. (a) Representative images of LysoTracker Red staining of OS cells following treatment with 25 nM erianin for 24 h. Red color intensity shows acidic vesicular organelles, indicating autophagosomes. (b) Representative micrographs of cells that shows GFP-LC3 localization. MG63.2 cells stably expressing GFP-LC3B were treated with control and the indicated concentrations of erianin for 24 h (upper panel) or 25 nM erianin for the indicated time (bottom panel). Erianin-treated cells displayed a punctate pattern of GFP-LC3 expression, representing formation of autophagosomes. (c) Cells were treated with various concentrations of erianin for 24 h. The expression of LC3B, Beclin-1, and p62 were analyzed by western blotting. (d) 143B cells were preincubated with 3-MA (5 mM) for 2 h and then treated with erianin for 24 h, followed by CCK8 assay of cell proliferation. (e) 143B was preincubated with 3-MA (5 mM) for 2 h and then treated with erianin for 24 h, followed by Annexin V-PE/7-AAD (7-aminoactinomycin D) staining. The percentage of apoptosis cells is shown as mean±S.D. from three independent experiments. *P<0.05, significantly different compared with the control and 3-MA-treated group. (f) 143B was preincubated with 3-MA (5 mM) for 2 h and then treated with erianin for 24 h, followed by western blotting analysis of apoptosis-related proteins

