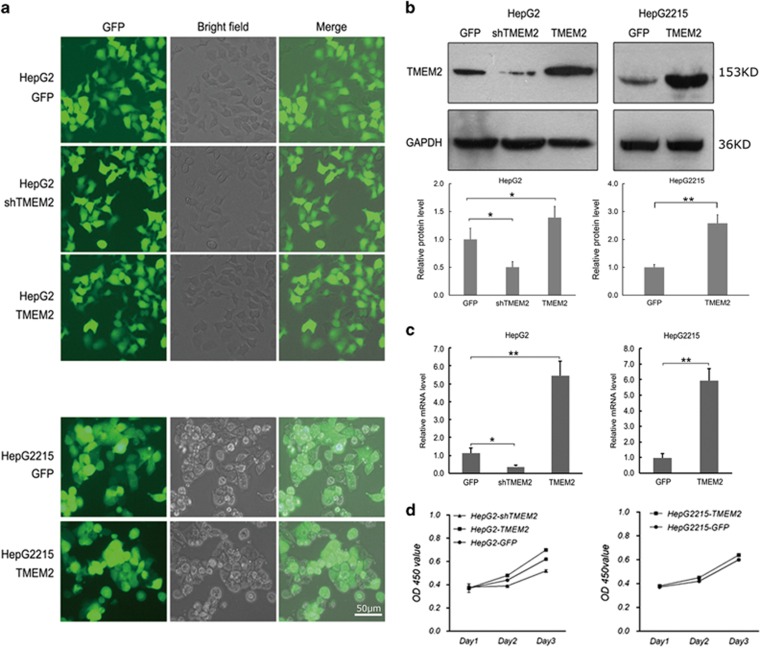
Figure 2.
Expression of TMEM2 in stable cell lines. (a) HepG2 GFP cells (the control HepG2 cells), HepG2 shTMEM2 cells with TMEM2 silenced, HepG2 TMEM2 cells with TMEM2 overexpression, HepG2.2.15 GFP cells (normal HepG2.2.15 cells), and HepG2.2.15 TMEM2 cells with TMEM2 overexpression. (b) Western blot results showed reduced expression of TMEM2 in HepG2 shTMEM2 cells (GFP versus HepG2 shTMEM2: *P<0.05; GFP versus HepG2 TMEM2: *P<0.05) and increased expression of TMEM2 in HepG2 TMEM2 and HepG2.2.15 TMEM2 cells (GFP versus HepG2215 TMEM2: **P<0.01). (c) RT-qPCR results showed reduced levels of TMEM2 mRNA in HepG2 shTMEM2 cells (GFP versus HepG2 shTMEM2: *P<0.05; GFP versus HepG2 TMEM2: **P<0.01) and increased mRNA levels of TMEM2 in HepG2 TMEM2 and HepG2.2.15 TMEM2 cells (GFP versus HepG2215 TMEM2: **P<0.01)). (d) Effect of TMEM2 silencing or overexpression on the kinetics of cell growth/cell death. Overexpression of TMEM2 slightly promoted the proliferation of HepG2 and HepG2.2.15 (P>0.05), and TMEM2 silencing slightly repressed the proliferation of HepG2 cells (P>0.05). Error bars are presented as S.D.

