Figure 2.
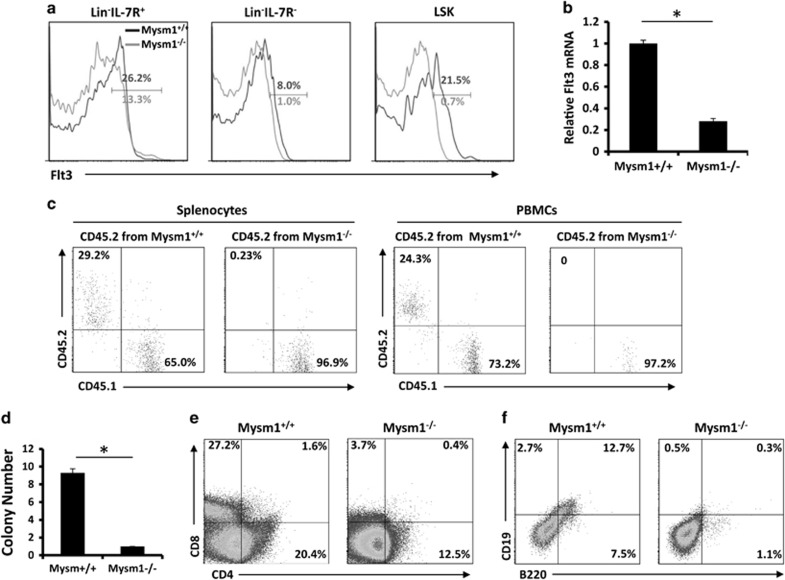
LSKs analyzed for T-cell lymphopoiesis in Mysm1−/− mice. (a) FACS analysis of expression of Flt3 in Lin− BM cells and LSKs (n=4). (b) Expression of Flt3 in Lin− BM as determined by qPCR (n=4). Bar graphs show means of three experiments±S.D. *P<0.05. (c) LSKs (CD45.2) isolated from WT or Mysm1−/− mice were mixed with WT BM cells (CD45.1) and i.v. injected into WT mice (CD45.1). Three weeks later, FACS analyzed splenocytes and PMBCs on differentiation of LSKs into T cells (n=4). (d) LSKs isolated from WT or Mysm1−/− mice (n=4) were cultured on feeder cell line (OP-9DL) monolayers in IL-7 and Flt3L-supplemented media in 96-well plates for T-cell colony formation. (e) The cultured LSKs (n=4) on feeder cell monolayers were analyzed for expression of T-cell markers CD4 or CD8. (f) The cultured LSKs on feeder cell monolayers were analyzed for expression of B-cell markers CD19 and B220. Data are representative of three independent experiments

