Figure 3.
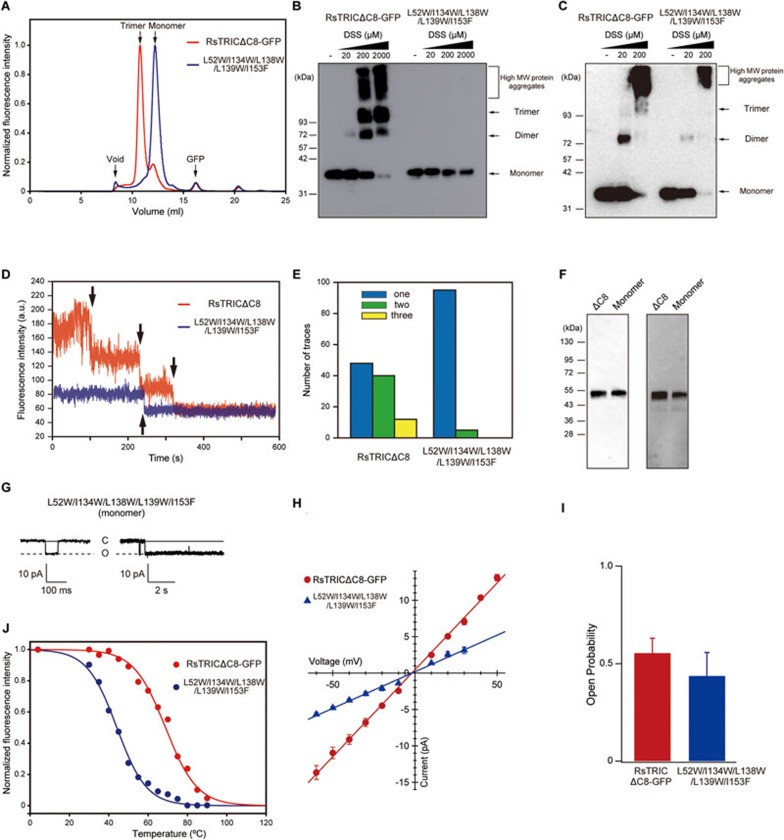
Monomeric mutant of RsTRIC. (A) FSEC profiles on a Superdex 200 Increase 10/300 GL column (GE Healthcare) for the GFP-tagged RsTRICΔC8 (red) and monomeric mutant (blue). The arrows indicate the elution positions of the void volume (void), the trimer of TRIC-GFP (trimer), the monomer of TRIC-GFP (monomer) and the free GFP (GFP). (B, C) Cross-linking experiments with the GFP-tagged RsTRICΔC8 and monomeric (L52W/L134W/L138W/L139W/I153F) mutant in detergent-soluble (B) and E. coli cell membrane-associated (C) forms. The theoretical molecular weight of the GFP-tagged RsTRICΔC8 monomer is about 40.5 kD. Increasing amounts of DSS (0, 20, 200 and 2 000 μM for soluble samples, and 0, 20 and 200 μM for membrane-associated samples) were used to cross-link the proteins. The brackets and arrows indicate high-molecular-weight (high MW) protein aggregates, and the trimer, dimer and monomer, respectively. (D) Representative ZMW traces of TMR-labeled RsTRICΔC8 (red) and monomeric mutant (blue) in nanodiscs. The black arrows represent photobleaching steps. (E) Event histograms for TMR-labeled RsTRICΔC8 (n = 100) and the monomeric mutant (n = 100). The TMR-labeled RsTRICΔC8 showed 48, 40 and 12 events for one, two and three photobleaching steps, and the monomeric mutant showed 95 and 5 events for one and two photobleaching steps, respectively. (F) Detection of HaloTag-fused RsTRIC proteins by an anti-His antibody western blot (left) and TMR fluorescence (right). In each panel, “ΔC8” and “Monomer” indicate the TMR-labeled RsTRICΔC8 and monomeric mutant, respectively. (G) Representative current traces recorded at −60 mV in a membrane patch of E. coli giant spheroplasts expressing the GFP-tagged monomeric mutant in KCl-containing solution (n = 5). Currents were recorded for 9 s in each step-pulse. An enlarged trace is presented on the left. Uppercase letters, C and O, indicate closed and open states, respectively. (H) Comparison of the current-voltage relationships (I-V curve) in the GFP-tagged RsTRICΔC8 (red) and the monomeric mutant (blue), determined by measuring the current amplitude from −60 mV to +40 mV by 10 mV steps. The values are means ± SEM (n = 6 in GFP-tagged RsTRICΔC8; n = 5 in monomeric mutant). (I) The open probabilities of the GFP-tagged RsTRICΔC8 and monomeric mutant at −60 mV. Bars depict means + SEM (n = 6 in GFP-tagged RsTRICΔC8; n = 5 in monomeric mutant). (J) The melting curves of RsTRCIΔC8 (red, Tm = 68.8 °C) and the monomeric mutant (blue, Tm = 44.1 °C).

