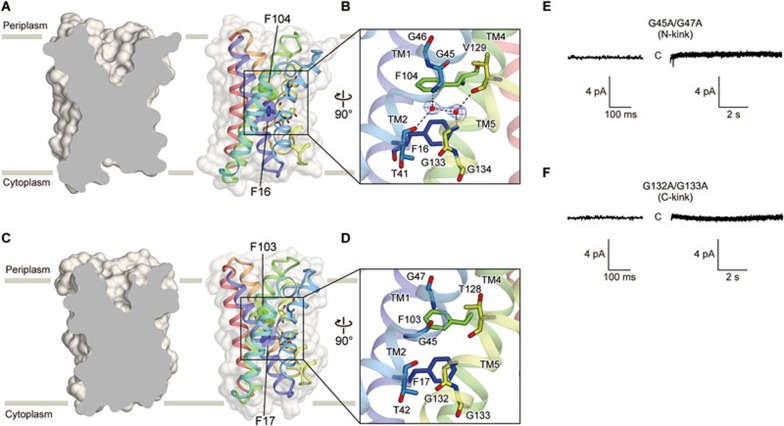
Figure 4.
Putative ion channel pore. (A, C) Cross-sections of surface representations of the SsTRIC (A) and RsTRIC (C) subunits, showing the ion channel pores. The Phe residues at the constriction sites are depicted by spheres. (B, D) Close-up views of the centers of the pores in SsTRIC (B) and RsTRIC (D). Water molecules are depicted by red spheres. The Fo − Fc electron density maps for water molecules, contoured at 3.5 σ, are shown. (E, F) Representative current traces recorded at −60 mV in a membrane patch of spheroplasts expressing the GFP-tagged RsTRICΔC8 N-kink (G45A/G47A; n = 3) (E) and C-kink (G132A/G133A; n = 3) (F) mutants. In each trace, an enlarged trace is presented on the left. The uppercase C indicates the closed state.

