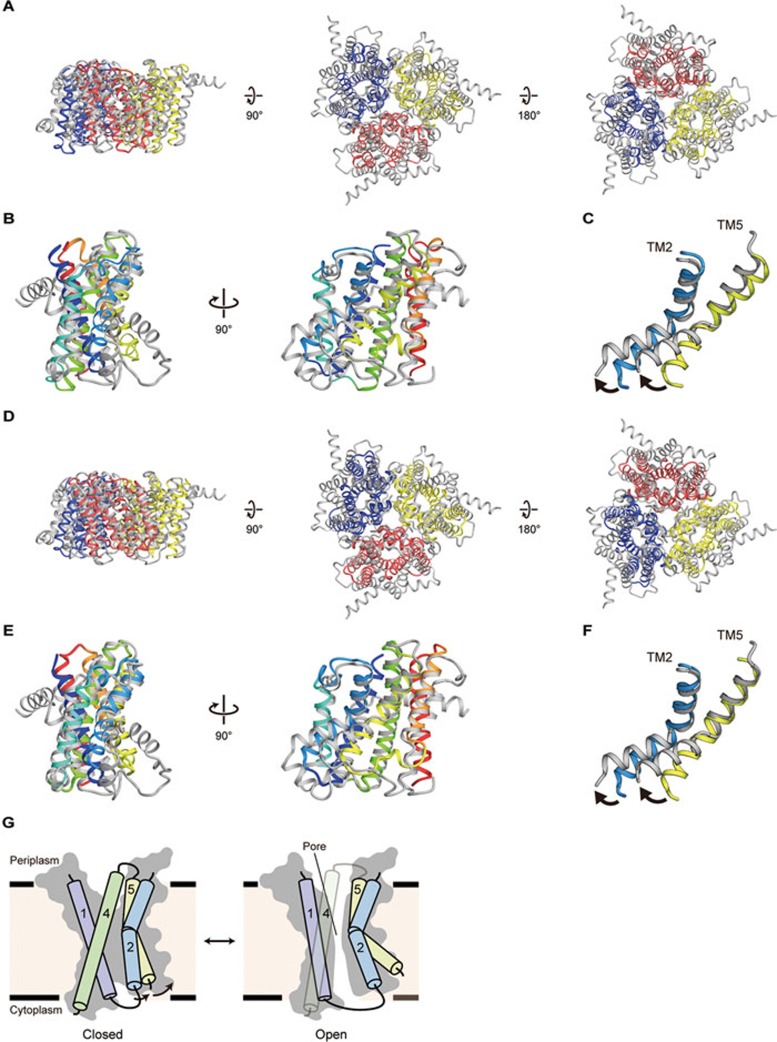
Figure 6.
Structural comparisons between prokaryotic and eukaryotic TRIC channels. (A) Representative superimposition of the trimers of SsTRIC and CeTRIC-B2 (PDB ID 5EIK), viewed parallel to the membrane (left), and from the periplasmic (middle) and cytoplasmic (right) sides. SsTRIC is colored as in Figure 2A, and CeTRIC-B2 is colored grey. The RMSD value is 4.5 Å for 461 Cα atoms. (B) Representative superimposition of the SsTRIC subunit and the CeTRIC-B2 subunit, viewed parallel to the membrane. SsTRIC is colored as in Figure 2C, and ceTRIC-B2 is colored grey. The RMSD value is 3.3 Å for 160 Cα atoms. (C) Close-up view of the superimposition of the SsTRIC subunit and the CeTRIC-B2 subunit. Only TM2 and TM5 are shown. The black arrows denote the movement of the TM helices. (D) Representative superimposition of the trimers of RsTRIC and CeTRIC-B2, viewed parallel to the membrane (left), and from the periplasmic (middle) and cytoplasmic (right) sides. RsTRIC is colored as in Figure 2B, and CeTRIC-B2 is colored grey. The RMSD value is 4.4 Å for 493 Cα atoms. (E) Representative superimposition of the RsTRIC subunit and the CeTRIC-B2 subunit, viewed parallel to the membrane. RsTRIC is colored in the same manner as SsTRIC in Figure 2C, and CeTRIC-B2 is colored grey. The RMSD value is 3.3 Å for 162 Cα atoms. (F) Close-up view of the superimposition of the RsTRIC subunit and the CeTRIC-B2 subunit. Only TM2 and TM5 are shown. The black arrows denote the movement of the TM helices. (G) Proposed mechanism of monomeric pore opening of TRIC channels, colored as in Figure 2C. Arrows indicate the kink motions of the TM2 and TM5 helices. TRIC subunits in the closed and open states are shown.

