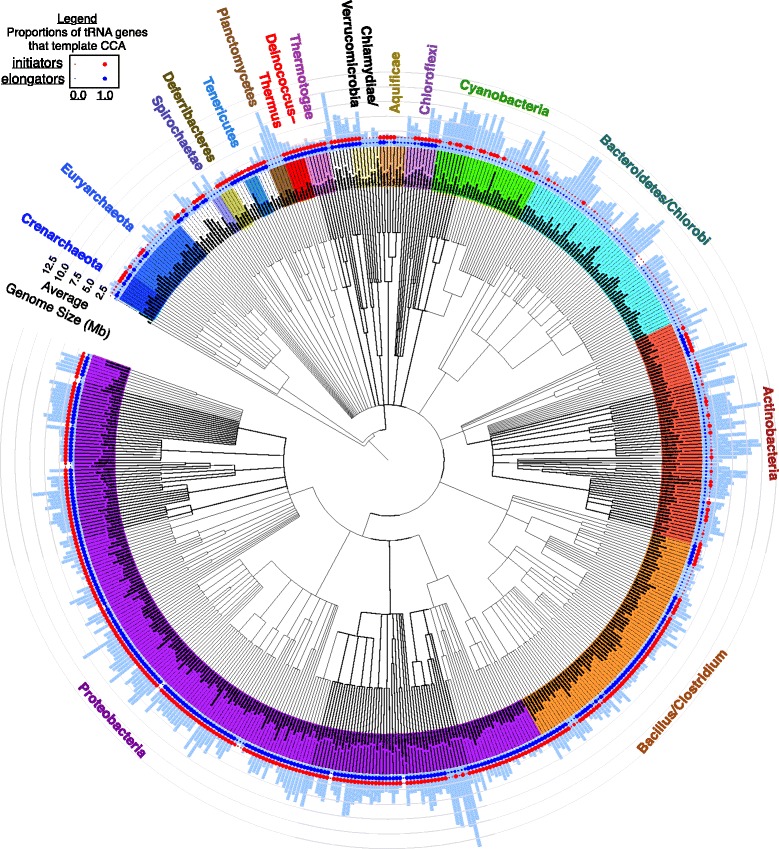
Fig. 1.

Summarized frequencies at which elongator tRNA genes and initiator tRNA genes template 3’-CCA against average genome size in different prokaryotic genera. NCBI-Taxonomy - based cladogram of prokaryotic genera in tRNAdb-CE v.8 showing average genome size (radial light blue bars) and average fractions at which elongator tRNA genes template 3’-CCA (blue circles) and initiator tRNA genes template 3’-CCA (red circles)
