
Fig. 2.
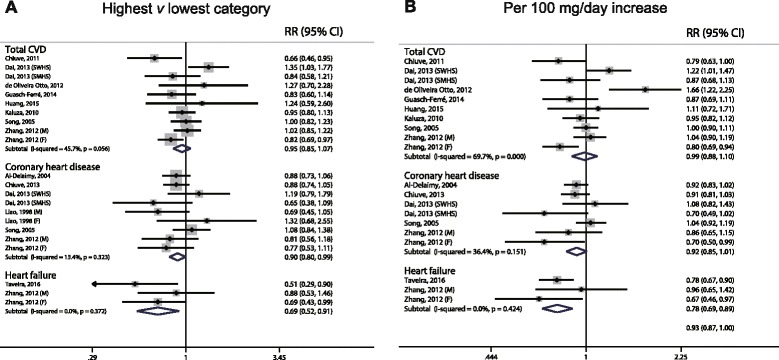
Forest plots of total cardiovascular disease, coronary heart disease, and heart failure for the highest versus lowest categories of dietary magnesium intake (a) and per 100 mg/day increase in dietary magnesium intake (b).
Official websites use .gov
A
.gov website belongs to an official
government organization in the United States.
Secure .gov websites use HTTPS
A lock (
) or https:// means you've safely
connected to the .gov website. Share sensitive
information only on official, secure websites.
Forest plots of total cardiovascular disease, coronary heart disease, and heart failure for the highest versus lowest categories of dietary magnesium intake (a) and per 100 mg/day increase in dietary magnesium intake (b).