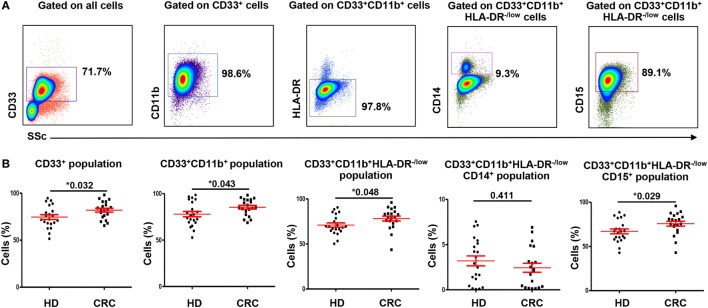
Figure 1.
Gating strategy of myeloid cells and comparisons of levels of different subsets of circulating myeloid cells between HDs and CRC patients. Representative flow cytometric plots showing the gating strategy used to identify myeloid cells in peripheral blood of HDs and CRC patients (A). CD33+ cells were gated first from all cells, followed by gating CD11b+ cells and HLA-DR−/low cells from parent populations. MMCs were then identified as CD14+ cells, while GMCs were identified based on the expression of CD15. Fresh whole blood from 21 HDs and 20 CRC patients was stained for these markers. (B) Shows scatter plots of the means of calculated percentages ± SEM of each myeloid subpopulation including CD33+ cells, CD33+CD11b+ cells, CD33+CD11b+HLA-DR−/low cells, CD33+CD11b+HLA-DR−/lowCD14+ cells, and CD33+CD11b+ HLA-DR−/lowCD15+ cells.

