Figure 3.
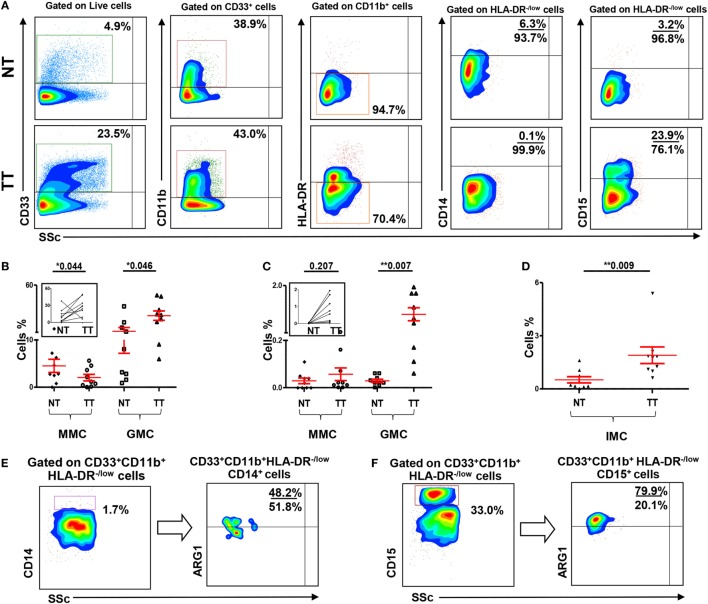
Myeloid cells and arginase 1 expression in tissue-infiltrating immune cells. (A) Representative flow cytometric plots showing levels of different subsets of myeloid cells in normal tissue (NT) and tumor tissue (TT) of nine CRC patients. Doublets were excluded and live cells were gated. The frequency of each population was calculated out of the parent population. Scatter plots showing mean of relative percentages ± SEM (B), and calculated percentages ± SEM, calculated by multiplying the relative percentages of each subpopulation with their respective parent populations, of CD33+CD11b+HLA-DR−/low CD14+ MMCs and CD33+CD11b+HLA-DR−/low CD15+ GMCs in NT and TT of CRC patients (C); inset showing the expansion of GMCs in TT compared with adjacent NT. (D) Means of calculated percentage ± SEM of CD33+CD11b+HLA-DR−CD14−CD15− IMCs in NT and TT. Representative flow cytometric plots show the expression of ARG1 by tumor-infiltrating CD33+CD11b+HLA-DR−/lowCD14+ MMCs (E) and CD33+CD11b+HLA-DR−/lowCD15+ GMCs (F) in tumor tissue of CRC patients.

