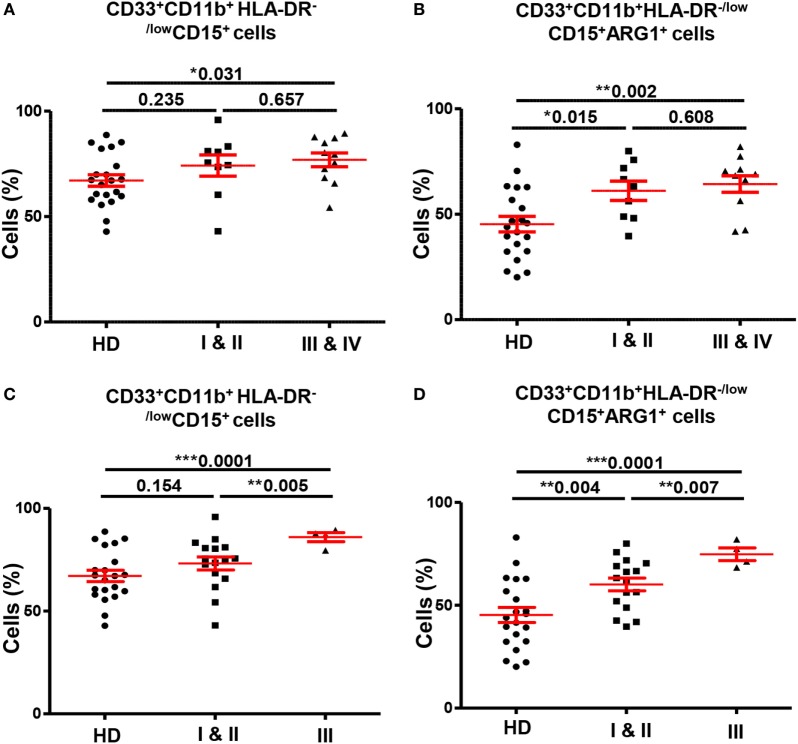
Figure 4.
Comparisons of levels of circulating GMCs between HDs and different TNM stages and histological grades of colorectal cancer. Scatter plots comparing calculated percentages ± SEM of CD33+CD11b+HLA-DR−/lowCD15+ GMCs (A) and their ARG1 level (B) between HDs and different TNM stages of CRC patients. Scatter plots comparing calculated percentages ± SEM of CD33+CD11b+HLA-DR−/lowCD15+ GMCs (C) and their ARG1 level (D) between HDs and different histological grades of CRC patients.

