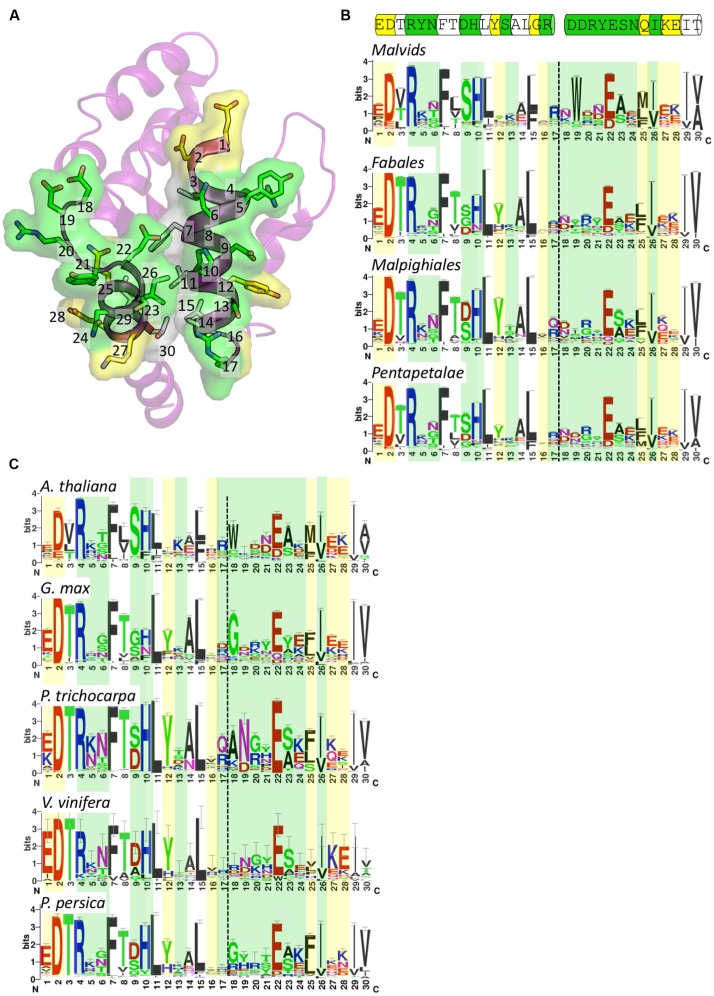
FIGURE 5.
Conservation of surface-exposed residues within the AE interface. (A) Crystal structure of RPV1 shown in ribbon representation with the face of the AE interface oriented toward the page. The AE interface residues are presented as sticks and are included in the sequence logos presented in (B,C). The numbering corresponds to position in the logos. Surface-exposed residues involved in interface interactions are colored green, surface-exposed residues not involved in interface interactions are colored yellow, and residues that are not surface-exposed are colored white. (B) Sequence logos of the AE interface in the families Malvids, Fabales, Malipighiales and Pentapetalae. Coloring as defined for (A). Dotted lines represent the division between the αA and αE regions. Cartoon above the logos represents the sequence of this region in RPV1 as shown in (A). (C) Sequence logos of the AE interface in the species A. thaliana, G. max, P. trichocarpa, V. vinifera, and P. persica colored and labeled as in (B).

